motivational analysis of organizations
motivational analysis of organizations
motivational analysis of organizations

Create successful ePaper yourself
Turn your PDF publications into a flip-book with our unique Google optimized e-Paper software.
RATIONALE FOR THE QUESTIONNAIRE<br />
The Managerial Attitude Questionnaire was designed to tap individual propensity to<br />
cope with ambiguity either by seeking closure or by seeking a broad range <strong>of</strong> options.<br />
Those taking the questionnaire are asked to distribute one hundred points over six<br />
responses for each <strong>of</strong> ten situations. A logarithmic transformation is then used to<br />
categorize individuals as having high, medium, or low tolerance for ambiguity<br />
(Shannon, 1948). The greater the number <strong>of</strong> categories over which points are distributed,<br />
the higher the assumed tolerance. The lower scores may indicate too low a tolerance for<br />
ambiguity or singlemindedness, while a high score may indicate lack <strong>of</strong> a clear direction<br />
or too much acceptance <strong>of</strong> ambiguity.<br />
One bit <strong>of</strong> data that tends to support such interpretations is that the obtained<br />
correlation between scores on the Rokeach Dogmatism Scale (1960) and scores on the<br />
Managerial Attitude Questionnaire is -.36 in a sample <strong>of</strong> thirty working adults. This<br />
finding indicates that those people who are more tolerant <strong>of</strong> ambiguity are less dogmatic<br />
in their personal belief systems, which is as one would predict.<br />
USES FOR THE QUESTIONNAIRE<br />
Participants may be asked to discuss the ten incidents and the weights they assigned to<br />
the various alternatives. This can prove interesting and show those who tend to<br />
discriminate the most and the least. Comparisons between groups <strong>of</strong> students and groups<br />
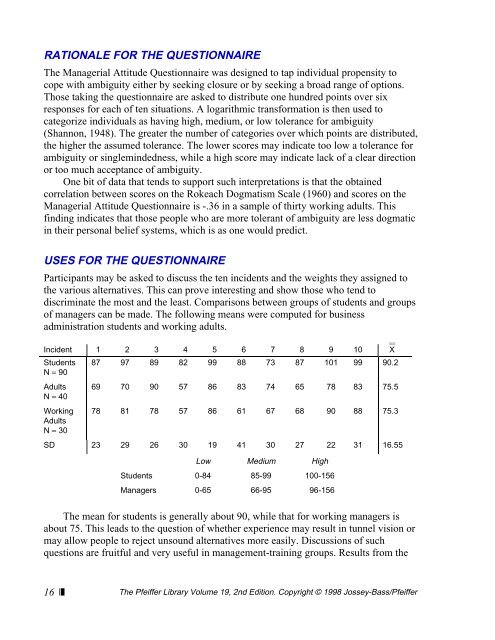
<strong>of</strong> managers can be made. The following means were computed for business<br />
administration students and working adults.<br />
Incident 1 2 3 4 5 6 7 8 9 10 X<br />
Students<br />
N = 90<br />
87 97 89 82 99 88 73 87 101 99 90.2<br />
Adults<br />
N = 40<br />
Working<br />
Adults<br />
N = 30<br />
16 ❘❚<br />
69 70 90 57 86 83 74 65 78 83 75.5<br />
78 81 78 57 86 61 67 68 90 88 75.3<br />
SD 23 29 26 30 19 41 30 27 22 31 16.55<br />
Low Medium High<br />
Students 0-84 85-99 100-156<br />
Managers 0-65 66-95 96-156<br />
The mean for students is generally about 90, while that for working managers is<br />
about 75. This leads to the question <strong>of</strong> whether experience may result in tunnel vision or<br />
may allow people to reject unsound alternatives more easily. Discussions <strong>of</strong> such<br />
questions are fruitful and very useful in management-training groups. Results from the<br />
The Pfeiffer Library Volume 19, 2nd Edition. Copyright © 1998 Jossey-Bass/Pfeiffer<br />
==