- Page 1 and 2:
Bureau d’audiences publiques sur
- Page 3:
Ms. Line Beauchamp Minister of Sust
- Page 6 and 7:
In terms of its integration into th
- Page 9 and 10:
Table of contents Opinions and reco
- Page 11 and 12:
Table of contents Land use and appl
- Page 13:
Table of contents Project impacts o
- Page 16 and 17:
List of figures and tables Table 5
- Page 18 and 19:
Opinions and recommendations reques
- Page 20 and 21:
Opinions and recommendations Opinio
- Page 22 and 23:
Opinions and recommendations needs
- Page 24 and 25:
Opinions and recommendations Enviro
- Page 27 and 28:
Introduction The Rabaska LNG termin
- Page 29 and 30:
Introduction The terminal would als
- Page 31:
Introduction encompasses biophysica
- Page 38 and 39:
Opinions of participants firmly opp
- Page 40 and 41:
Opinions of participants One partic
- Page 42 and 43:
Opinions of participants DT33, p. 1
- Page 44 and 45:
Opinions of participants Many were
- Page 46 and 47:
Opinions of participants “a price
- Page 48 and 49:
Opinions of participants Climate ch
- Page 50 and 51:
Opinions of participants reached, t
- Page 52 and 53:
Opinions of participants l’enviro
- Page 54 and 55: Opinions of participants In contras
- Page 56 and 57: Opinions of participants Moreover,
- Page 58 and 59: Opinions of participants Some parti
- Page 60 and 61: Opinions of participants […] we w
- Page 62 and 63: Opinions of participants monuments
- Page 64 and 65: Opinions of participants area […]
- Page 66 and 67: Opinions of participants On another
- Page 68 and 69: Opinions of participants A certain
- Page 70 and 71: Opinions of participants participan
- Page 72 and 73: Opinions of participants from perpe
- Page 74 and 75: Opinions of participants proponent
- Page 76 and 77: Opinions of participants We are per
- Page 78 and 79: Opinions of participants The risk a
- Page 80 and 81: Opinions of participants Should an
- Page 82 and 83: Opinions of participants Some parti
- Page 84 and 85: Opinions of participants use our co
- Page 86 and 87: Opinions of participants It can see
- Page 88 and 89: Opinions of participants underscore
- Page 90 and 91: Opinions of participants There is a
- Page 92 and 93: Opinions of participants Moreover,
- Page 95 and 96: Chapter 2 Project energy context Th
- Page 97 and 98: Project energy context ♦ Finding
- Page 99 and 100: Project context at the Quebec - Ont
- Page 101 and 102: Project energy context As for Quebe
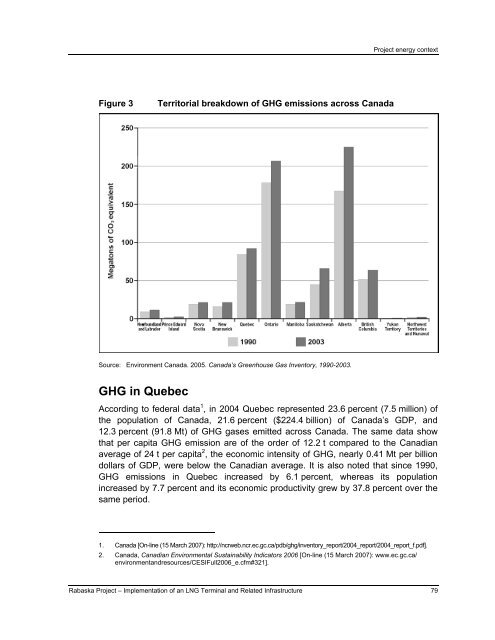
- Page 103: Project energy context The proponen
- Page 107 and 108: Project energy context and the comm
- Page 109 and 110: Project energy context implementati
- Page 111 and 112: Chapter 3 Economic context of the p
- Page 115 and 116: The project’s economic spin-offs
- Page 117: The structuring potential of the pr
- Page 120 and 121: Territorial context of the project
- Page 122 and 123: Territorial context of the project
- Page 124 and 125: Territorial context of the project
- Page 126: Territorial context of the project
- Page 130 and 131: Territorial context of the project
- Page 132 and 133: Territorial context of the project
- Page 134: Territorial context of the project
- Page 138 and 139: Territorial context of the project
- Page 140 and 141: Territorial context of the project
- Page 142 and 143: Assessing the risks related to the
- Page 144 and 145: Assessing the risks related to the
- Page 146 and 147: Assessing the risks related to the
- Page 148 and 149: Assessing the risks related to the
- Page 150 and 151: Assessing the risks related to the
- Page 152 and 153: Assessing the risks related to the
- Page 154 and 155:
Assessing the risks related to the
- Page 156 and 157:
Assessing the risks related to the
- Page 158:
Assessing the risks related to the
- Page 162 and 163:
Assessing the risks related to the
- Page 164 and 165:
Assessing the risks related to the
- Page 166:
Assessing the risks related to the
- Page 170:
Assessing the risks related to the
- Page 174 and 175:
Assessing the risks related to the
- Page 176:
Assessing the risks related to the
- Page 180 and 181:
Assessing the risks related to the
- Page 182:
Assessing the risks related to the
- Page 186:
Assessing the risks related to the
- Page 190 and 191:
Assessing the risks related to the
- Page 192 and 193:
Assessing the risks related to the
- Page 194 and 195:
Assessing the risks related to the
- Page 196 and 197:
Assessing the risks related to the
- Page 199 and 200:
Chapter 6 Social acceptance of the
- Page 201 and 202:
Social acceptance of the project By
- Page 203 and 204:
Social acceptance of the project -
- Page 205:
Social acceptance of the project
- Page 208 and 209:
Impacts on the inhabited area and h
- Page 210 and 211:
Impacts on the inhabited area and h
- Page 212 and 213:
Impacts on the inhabited area and h
- Page 214 and 215:
Impacts on the inhabited area and h
- Page 216 and 217:
Impacts on the inhabited area and h
- Page 218 and 219:
Impacts on the inhabited area and h
- Page 220 and 221:
Impacts on the inhabited area and h
- Page 222 and 223:
Impacts on the inhabited area and h
- Page 224 and 225:
Impacts on the inhabited area and h
- Page 226:
Impacts on the natural environment
- Page 230:
Impacts on the natural environment
- Page 234 and 235:
Impacts on the natural environment
- Page 236 and 237:
Impacts on the natural environment
- Page 238 and 239:
Impacts on the natural environment
- Page 240 and 241:
Impacts on the natural environment
- Page 242 and 243:
Impacts on the natural environment
- Page 244 and 245:
Impacts on the natural environment
- Page 246 and 247:
Impacts on the natural environment
- Page 248 and 249:
Impacts on the natural environment
- Page 250 and 251:
Impacts on the natural environment
- Page 252 and 253:
Conclusion In order to optimize the
- Page 255 and 256:
References ASSOCIATION DES PLUS BEA


