Report - Agence canadienne d'évaluation environnementale
Report - Agence canadienne d'évaluation environnementale
Report - Agence canadienne d'évaluation environnementale
You also want an ePaper? Increase the reach of your titles
YUMPU automatically turns print PDFs into web optimized ePapers that Google loves.
Chapter 3 Economic context of the project<br />
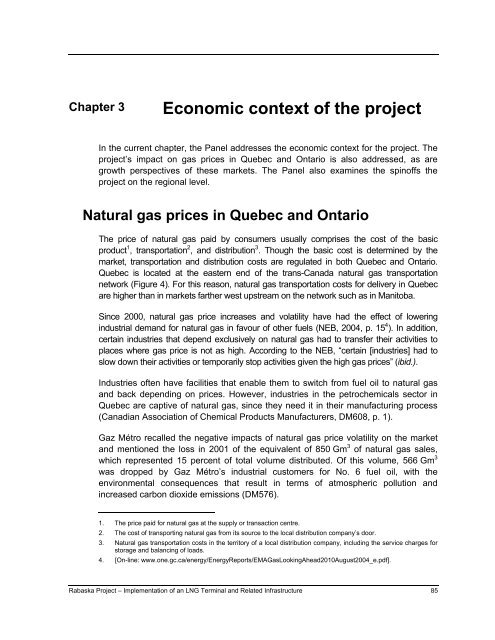
In the current chapter, the Panel addresses the economic context for the project. The<br />
project’s impact on gas prices in Quebec and Ontario is also addressed, as are<br />
growth perspectives of these markets. The Panel also examines the spinoffs the<br />
project on the regional level.<br />
Natural gas prices in Quebec and Ontario<br />
The price of natural gas paid by consumers usually comprises the cost of the basic<br />
product 1 , transportation 2 , and distribution 3 . Though the basic cost is determined by the<br />
market, transportation and distribution costs are regulated in both Quebec and Ontario.<br />
Quebec is located at the eastern end of the trans-Canada natural gas transportation<br />
network (Figure 4). For this reason, natural gas transportation costs for delivery in Quebec<br />
are higher than in markets farther west upstream on the network such as in Manitoba.<br />
Since 2000, natural gas price increases and volatility have had the effect of lowering<br />
industrial demand for natural gas in favour of other fuels (NEB, 2004, p. 15 4 ). In addition,<br />
certain industries that depend exclusively on natural gas had to transfer their activities to<br />
places where gas price is not as high. According to the NEB, “certain [industries] had to<br />
slow down their activities or temporarily stop activities given the high gas prices” (ibid.).<br />
Industries often have facilities that enable them to switch from fuel oil to natural gas<br />
and back depending on prices. However, industries in the petrochemicals sector in<br />
Quebec are captive of natural gas, since they need it in their manufacturing process<br />
(Canadian Association of Chemical Products Manufacturers, DM608, p. 1).<br />
Gaz Métro recalled the negative impacts of natural gas price volatility on the market<br />
and mentioned the loss in 2001 of the equivalent of 850 Gm 3 of natural gas sales,<br />
which represented 15 percent of total volume distributed. Of this volume, 566 Gm 3<br />
was dropped by Gaz Métro’s industrial customers for No. 6 fuel oil, with the<br />
environmental consequences that result in terms of atmospheric pollution and<br />
increased carbon dioxide emissions (DM576).<br />
1. The price paid for natural gas at the supply or transaction centre.<br />
2. The cost of transporting natural gas from its source to the local distribution company’s door.<br />
3. Natural gas transportation costs in the territory of a local distribution company, including the service charges for<br />
storage and balancing of loads.<br />
4. [On-line: www.one.gc.ca/energy/Energy<strong>Report</strong>s/EMAGasLookingAhead2010August2004_e.pdf].<br />
Rabaska Project – Implementation of an LNG Terminal and Related Infrastructure 85


