- Page 1 and 2:
Air Toxics Hot Spots Program Risk A
- Page 3 and 4:
Prepared by: John D. Budroe, Ph.D.
- Page 5 and 6:
This document is one of five docume
- Page 7 and 8:
TABLE OF CONTENTS PREFACE i INTRODU
- Page 9 and 10:
N-Nitrosodimethylamine 401 N-Nitros
- Page 11 and 12:
Hot Spots Unit Risk and Cancer Pote
- Page 13 and 14:
Hot Spots Unit Risk and Cancer Pote
- Page 15 and 16:
Hot Spots Unit Risk and Cancer Pote
- Page 17 and 18:
Additional ATES and PETS documents
- Page 19 and 20:
data. If several data sets (dose an
- Page 21 and 22:
US EPA Calculation of Carcinogenic
- Page 23 and 24:
exposure to a concentration of 1 µ
- Page 25 and 26:
incidences for each of the dose lev
- Page 27 and 28:
computes the surface area of a sphe
- Page 29 and 30:
Comparison of Hot Spots Cancer Unit
- Page 31 and 32:
Gold, L., de Veciana, M., Backman,
- Page 33 and 34:
Animal Studies Rats Woutersen et al
- Page 35 and 36:
ased on sufficient evidence of carc
- Page 37 and 38:
ACETAMIDE CAS No: 60-35-5 I. PHYSIC
- Page 39 and 40:
Methodology Expedited Proposition 6
- Page 41 and 42:
cancer mortality. However, US EPA (
- Page 43 and 44:
Table 2. Lung adenoma incidence in
- Page 45 and 46:
Table 3 (continued). Acrylamide-ind
- Page 47 and 48:
Robinson M, Bull RJ, Knutsen GL, Sh
- Page 49 and 50:
Also, a trend was observed correlat
- Page 51 and 52:
eported. Cause-specific expected de
- Page 53 and 54:
Bio/Dynamics Inc. conducted a study
- Page 55 and 56:
examination. Interim sacrifices wer
- Page 57 and 58:
Table 8. Tumor incidence in male an
- Page 59 and 60:
Gaffey WR and Strauss ME. 1981. A m
- Page 61 and 62:
(technical grade; 98% pure) by gava
- Page 63 and 64:
International Agency for Research o
- Page 65 and 66:
still alive in the low-dose control
- Page 67 and 68:
ANILINE CAS No: 62-53-3 I. PHYSICAL
- Page 69 and 70:
fibrosarcomas, stromal sarcomas, ca
- Page 71 and 72:
ARSENIC (INORGANIC) CAS No: 7440-38
- Page 73 and 74:
elationship between arsenic exposur
- Page 75 and 76:
al. (1988) did not induce lung tumo
- Page 77 and 78:
A risk assessment was also conducte
- Page 79 and 80:
Chen C, Chuang Y, You S, Lin T and
- Page 81 and 82:
Schrauzer G, White D, McGinness J,
- Page 83 and 84:
Table 1: Summary of epidemiologic s
- Page 85 and 86:
had at least one animal demonstrati
- Page 87 and 88:
mesothelioma, recommended lifetime
- Page 89 and 90:
National Institute for Occupational
- Page 91 and 92:
BENZENE CAS No: 71-43-2 I. PHYSICAL
- Page 93 and 94:
Animal Studies Available experiment
- Page 95 and 96:
Table 3: Summary of NTP bioassay re
- Page 97 and 98:
Table 4: Summary of benzene low-dos
- Page 99 and 100:
Maltoni C, Conti B and Cotti G. 198
- Page 101 and 102:
a benign tumor of the kidney. No ba
- Page 103 and 104:
al. (1968) found no tumors in lifet
- Page 105 and 106:
following relationship, where C(t 1
- Page 107 and 108:
Miakawa M. and Yoshida O. 1975. Pro
- Page 109 and 110:
human population and that BPDE-DNA
- Page 111 and 112:
demonstrated the tumor initiating a
- Page 113 and 114:
Table 4: Bronchoalveolar tumors fro
- Page 115 and 116:
Table 5: IARC groupings of PAHs, mi
- Page 117 and 118:
Table 6 (continued): IARC Group 3 P
- Page 119 and 120:
Potency Equivalency Factors (PEF) f
- Page 121 and 122:
This was rounded to a PEF of 0.1. 1
- Page 123 and 124:
experiment (Takayama et al., 1985)
- Page 125 and 126:
Deutsch-Wenzel RP, Brune H, Grimmer
- Page 127 and 128:
Krewski D, Thorslund T and Withey J
- Page 129 and 130:
U.S. Environmental Protection Agenc
- Page 131 and 132:
Sorahan et al. (1983) studied cance
- Page 133 and 134:
Lijinsky W. 1986. Chronic bioassay
- Page 135 and 136:
the drinking water (Schroeder and M
- Page 137 and 138:
Table II. Effective dose, upper-bou
- Page 139 and 140:
BIS(2-CHLOROETHYL)ETHER CAS No: 111
- Page 141 and 142:
IV. DERIVATION OF CANCER POTENCY Ba
- Page 143 and 144:
BIS(CHLOROMETHYL)ETHER CAS No: 542-
- Page 145 and 146:
Table 1. Bis(chloromethyl)ether-ind
- Page 147 and 148:
Drew RT, Laskin S, Kuschner M and N
- Page 149 and 150:
ates for the 1968 U.S. male populat
- Page 151 and 152:
Table 1: Incidence of primary tumor
- Page 153 and 154:
IV. DERIVATION OF CANCER POTENCY Ba
- Page 155 and 156:
National Institute of Occupational
- Page 157 and 158:
was less than 0.05 when controlling
- Page 159 and 160:
up period. The final cohort include
- Page 161 and 162:
If the cadmium-exposed workers incl
- Page 163 and 164:
on personnel records (20%); (3) eva
- Page 165 and 166:
were exposed to a continuous (23.5
- Page 167 and 168:
procedure (NLIN), the parameters we
- Page 169 and 170:
International Agency for Research o
- Page 171 and 172:
Two reports were published on cance
- Page 173 and 174:
Mendel rats, respectively), and sub
- Page 175 and 176:
Eschenbrenner A and Miller E. 1946.
- Page 177 and 178:
III. CARCINOGENIC EFFECTS Human Stu
- Page 179 and 180:
cancers, were less than expected. T
- Page 181 and 182:
and no cases of cancer (although cl
- Page 183 and 184:
There was a statistically significa
- Page 185 and 186:
NTP (1982a) also conducted an carci
- Page 187 and 188:
Several pathologists have independe
- Page 189 and 190:
hepatocellular adenoma/carcinoma tu
- Page 191 and 192:
carcinogenic potency may decline in
- Page 193 and 194:
Cochrane W, Singh J and Miles W. 19
- Page 195 and 196:
North Atlantic Treaty Organization,
- Page 197 and 198:
CHLORINATED PARAFFINS (average chai
- Page 199 and 200:
ased on dose-response data for beni
- Page 201 and 202:
chloroform in drinking water with k
- Page 203 and 204:
Overall, the present epidemiologica
- Page 205 and 206:
female dogs received toothpaste bas
- Page 207 and 208:
Calculated q 1 * values from the ab
- Page 209 and 210:
Hogan MD, Chi Py, Hoel DG and Mitch
- Page 211 and 212:
Table 1. Study design summary for N
- Page 213 and 214:
V. REFERENCES California Environmen
- Page 215 and 216:
toluidine. Followup of this subcoho
- Page 217 and 218:
feeding studies on by NCI (1979) us
- Page 219 and 220:
CHROMIUM (HEXAVALENT) CAS No: 18540
- Page 221 and 222:
expected rate may be inflated becau
- Page 223 and 224:
Oral Borneff et al. (1968) exposed
- Page 225 and 226:
CREOSOTE (COAL TAR-DERIVED) CAS No:
- Page 227 and 228:
from an inhalation exposure study (
- Page 229 and 230:
U.S. Environmental Protection Agenc
- Page 231 and 232:
Table 1. Study design summary for N
- Page 233 and 234:
Methodology Expedited Proposition 6
- Page 235 and 236:
Table 1. Experimental design for ca
- Page 237 and 238:
Hazardous Substance Data Bank (HSDB
- Page 239 and 240:
Table 1: Tumor induction in Fischer
- Page 241 and 242:
Hazardous Substance Data Bank (HSDB
- Page 243 and 244:
Table 1. Experimental design of 2,4
- Page 245 and 246:
Methodology Expedited Proposition 6
- Page 247 and 248:
Additional analysis of these data b
- Page 249 and 250:
IV. DERIVATION OF CANCER POTENCY Ba
- Page 251 and 252:
Jackson RJ, Greene CJ, Thomas JT, M
- Page 253 and 254:
Table 1. Tumor incidence in rats ex
- Page 255 and 256:
Girard R, Tolot F, Martin P and Bou
- Page 257 and 258:
exposed more than 16 years before t
- Page 259 and 260:
interpretation of dose extrapolatio
- Page 261 and 262:
1, 1-DICHLOROETHANE CAS No: 75-34-3
- Page 263 and 264:
Table 1b. Study design for carcinog
- Page 265 and 266:
National Cancer Institute (NCI) 197
- Page 267 and 268:
mice, hepatocellular carcinoma inci
- Page 269 and 270:
V. REFERENCES California Department
- Page 271 and 272:
DAB/day by gavage for the life of t
- Page 273 and 274:
2,4-DINITROTOLUENE CAS No: 121-14-2
- Page 275 and 276:
Ellis et al.(1979) (also reported b
- Page 277 and 278:
Final Statement of Reasons for OAL,
- Page 279 and 280:
to the small sample size and short
- Page 281 and 282:
In an inhalation study, Torkelson e
- Page 283 and 284:
V. REFERENCES American Conference o
- Page 285 and 286:
EPICHLOROHYDRIN CAS No: 106-89-8 I.
- Page 287 and 288:
espiratory tumors were noted in the
- Page 289 and 290:
Table 4. Epichlorohydrin-induced fo
- Page 291 and 292:
Konishi Y, Kawabata A, Denda A, Ike
- Page 293 and 294:
exposed to arsenicals for 20 months
- Page 295 and 296:
espectively (all statistically sign
- Page 297 and 298:
ETHYLENE DICHLORIDE CAS No: 107-06-
- Page 299 and 300:
Several factors have been suggested
- Page 301 and 302:
U.S. Environmental Protection Agenc
- Page 303 and 304:
myelogenous leukemias (4 and 8 year
- Page 305 and 306:
statistically significant. CDHS not
- Page 307 and 308:
combined with the incidence in the
- Page 309 and 310:
incidence of primary brain tumors.
- Page 311 and 312:
Table 6 (continued): Organ/Sex Mali
- Page 313 and 314:
An Upper 95% Confidence Limit (UCL)
- Page 315 and 316:
ETHYLENE THIOUREA (ETU) CAS No: 96-
- Page 317 and 318:
male and female rats. Tumor inciden
- Page 319 and 320:
FORMALDEHYDE CAS No: 50-00-0 I. PHY
- Page 321 and 322:
presented an extension of a previou
- Page 323 and 324:
Methodology In developing a spectru
- Page 325 and 326:
Casanova M, Morgan KT, Steinhagen W
- Page 327 and 328:
Tobe M, Kaneko T, Uchida Y, Kamata
- Page 329 and 330:
Table 1. Hexachlorobenzene-induced
- Page 331 and 332:
50 pups (F 1 ) of each sex were ran
- Page 333 and 334:
Ertürk E, Lambrecht RW, Peters HA,
- Page 335 and 336:
Table 1. Liver hepatoma incidence i
- Page 337 and 338:
1988). An airborne unit risk factor
- Page 339 and 340:
HYDRAZINE CAS No: 302-01-2 I. PHYSI
- Page 341 and 342:
Methodology Inhalation A linearized
- Page 343 and 344:
LEAD AND LEAD COMPOUNDS (INORGANIC)
- Page 345 and 346:
and other occupational carcinogens
- Page 347 and 348:
y inhalation is similar for rats an
- Page 349 and 350:
Goyer RA. 1992. Nephrotoxicity and
- Page 351 and 352:
LINDANE (g-Hexachlorocyclohexane) C
- Page 353 and 354:
Using these relationships, a human
- Page 355 and 356:
METHYL TERT-BUTYL ETHER (MTBE) CAS
- Page 357 and 358:
Tumor incidences according to the r
- Page 359 and 360:
kidney changes indicative of chroni
- Page 361 and 362:
Interspecies scaling for oral doses
- Page 363 and 364:
Table 4 (continued): Dose Response
- Page 365 and 366:
Experimental Pathology Laboratories
- Page 367 and 368:
Animal Studies Male and female HaM/
- Page 369 and 370:
Gold L, Sawyer C, Magaw R, Backman
- Page 371 and 372:
Using the statistical tests (one-ta
- Page 373 and 374:
Table 1: Methylene chloride-induced
- Page 375 and 376:
Significant treatment-related incre
- Page 377 and 378:
National Toxicology Program (NTP) 1
- Page 379 and 380:
noted; however, the study duration
- Page 381 and 382:
Crump KS, Howe RB, Van Landingham C
- Page 383 and 384:
Table 1. Michler’s ketone-induced
- Page 385 and 386:
NICKEL AND NICKEL COMPOUNDS CAS No:
- Page 387 and 388:
the high exposure group was 14.0. A
- Page 389 and 390:
male and 121 female rats, was expos
- Page 391 and 392:
2.1 - 2.6 × 10 -4 (µg/m 3 ) -1 .
- Page 393 and 394:
U.S. Environmental Protection Agenc
- Page 395 and 396:
The increased incidence of bladder
- Page 397 and 398:
A linearized multistage procedure w
- Page 399 and 400:
N-NITROSO-N-METHYLETHYLAMINE CAS No
- Page 401 and 402:
Hazardous Substance Data Bank (HSDB
- Page 403 and 404:
propylamine in drinking water at 0.
- Page 405 and 406:
N-NITROSODIETHYLAMINE CAS No: 55-18
- Page 407 and 408:
Table 2. Treatment groups, concentr
- Page 409 and 410:
California Department of Health Ser
- Page 411 and 412:
animals and the second generation t
- Page 413 and 414:
ationale for selection of the OEHHA
- Page 415 and 416:
A unit risk value based upon air co
- Page 417 and 418:
N-NITROSODIPHENYLAMINE CAS No: 86-3
- Page 419 and 420:
Methodology Dosage estimates of NDP
- Page 421 and 422:
Crump KS, Howe RB. 1984. The multis
- Page 423 and 424: Table 1. P-Nitrosodiphenylamine-ind
- Page 425 and 426: N-NITROSOMORPHOLINE CAS No: 59-89-2
- Page 427 and 428: IV. DERIVATION OF CANCER POTENCY Ba
- Page 429 and 430: N-NITROSOPIPERIDINE CAS No: 100-75-
- Page 431 and 432: Table 3. N-Nitrosopiperidine-induce
- Page 433 and 434: Crump KS, Howe RB, Van Landingham C
- Page 435 and 436: testicular tumors were noted in the
- Page 437 and 438: PARTICULATE MATTER FROM DIESEL-FUEL
- Page 439 and 440: etired railroad workers who had had
- Page 441 and 442: employment (χ 2 test for trend: p
- Page 443 and 444: elevated smoking-adjusted risk esti
- Page 445 and 446: Table 1 (continued): Reference Miln
- Page 447 and 448: Table 1 (continued): Reference Damb
- Page 449 and 450: Table 1 (continued): Reference Burn
- Page 451 and 452: Table 1 (continued): Reference Raff
- Page 453 and 454: Table 1 (continued): Epidemiologica
- Page 455 and 456: Table 1 (continued): Epidemiologica
- Page 457 and 458: Table 1 (continued): Reference Wegm
- Page 459 and 460: Animal Studies Section 6.1 (Animal
- Page 461 and 462: The variability, or heterogeneity,
- Page 463 and 464: estimate for those studies for whic
- Page 465 and 466: Figure 1: Estimates of Relative Ris
- Page 467 and 468: q 1 * = Excess relative risk × CA
- Page 469 and 470: Table 3: Number of Workers in the E
- Page 471 and 472: u nexposed workers at zero concentr
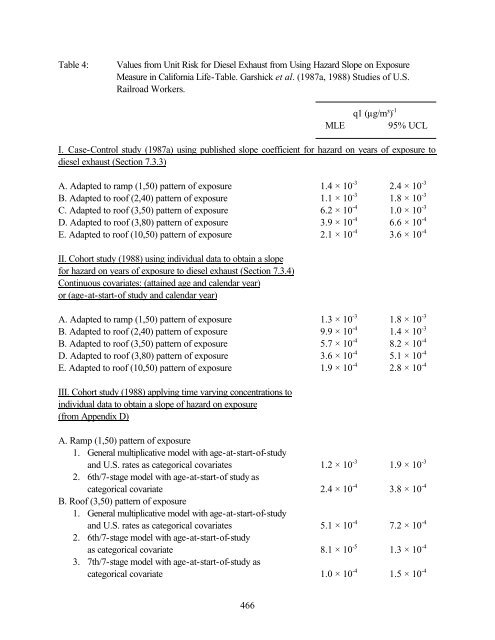
- Page 473: for each µg/m 3 of diesel exhaust
- Page 477 and 478: their findings that a reasonable es
- Page 479 and 480: Garshick E, Schenker M, Woskie S an
- Page 481 and 482: Lewis T, Green, FH MW, Burg J and L
- Page 483 and 484: Rothman K. 1986. Modern epidemiolog
- Page 485 and 486: PENTACHLOROPHENOL CAS No: 87-86-5 I
- Page 487 and 488: The default lifespan for mice is 10
- Page 489 and 490: documented. An excess risk from ski
- Page 491 and 492: B6C3F 1 mice and F344/N rats were e
- Page 493 and 494: This model, rather than a time depe
- Page 495 and 496: POLYCHLORINATED BIPHENYLS (PCBs) CA
- Page 497 and 498: several benign adenomatous lesions
- Page 499 and 500: Ito et al. (1973) exposed groups of
- Page 501 and 502: could not be characterized by chlor
- Page 503 and 504: exposure (all pathways and mixtures
- Page 505 and 506: National Toxicology Program 1993. T
- Page 507 and 508: Table 1. Potassium bromate-induced
- Page 509 and 510: 1,3-PROPANE SULTONE CAS No: 1120-71
- Page 511 and 512: IV. DERIVATION OF CANCER POTENCY Ba
- Page 513 and 514: PROPYLENE OXIDE CAS No: 75-56-9 I.
- Page 515 and 516: oxide. In the NTP carcinogenicity s
- Page 517 and 518: 1,1,2,2-TETRACHLOROETHANE CAS No: 7
- Page 519 and 520: assumed a body weight of 70 kg and
- Page 521 and 522: total); an untreated control group
- Page 523 and 524: TOLUENE DIISOCYANATE CAS No: 26471-
- Page 525 and 526:
Animal Studies The National Toxicol
- Page 527 and 528:
Mortillaro PT and Schiavon M. 1982.
- Page 529 and 530:
male or female rats. Increases in h
- Page 531 and 532:
TRICHLOROETHYLENE CAS No: 79-01-6 I
- Page 533 and 534:
A mortality analysis of a cohort of
- Page 535 and 536:
elative to that of the controls whi
- Page 537 and 538:
applied or metabolized. The range o
- Page 539 and 540:
Katz RM and Jowett D. 1981. Female
- Page 541 and 542:
10,000 ppm 2,4,6-trichlorophenol in
- Page 543 and 544:
IV. DERIVATION OF CANCER POTENCY Ba
- Page 545 and 546:
Bionetics Research Laboratories. 19
- Page 547 and 548:
control; females: 6/10 exposed, 0/1
- Page 549 and 550:
over controls (p < 0.04). Other tum
- Page 551 and 552:
was increased (100/314 exposed vs.
- Page 553 and 554:
Table 3. Cancer potency estimates f
- Page 555 and 556:
Crouch E. 1983. Uncertainties in in
- Page 557 and 558:
VINYL CHLORIDE CAS No: 75-01-4 I. P
- Page 559 and 560:
Table 1 (continued): A Summary of E
- Page 561 and 562:
al., 1983). Histopathology of all o
- Page 563 and 564:
Table 3: Tumor incidences in 100 pp
- Page 565 and 566:
experiment, animals were exposed to
- Page 567 and 568:
Experiment BT1 Most previous risk a
- Page 569 and 570:
No statistical analyses of mortalit
- Page 571 and 572:
Table 11 gives unit risk estimates
- Page 573 and 574:
Bertazzi PA, Villa A, Foa V, Saia B
- Page 575 and 576:
Nicholson WJ, Hammond EC, Seidman H
- Page 577 and 578:
immunotoxicity, reproductive toxici
- Page 579 and 580:
scheme. TEFs for two major noncance
- Page 581 and 582:
NATO/CCMS (1988a) Pilot Study on In
- Page 583 and 584:
Table 2 Toxicity Equivalency Factor
- Page 585 and 586:
Table 4 A Comparison of CTEF- and I
- Page 587 and 588:
Office of Environmental Health Haza
- Page 589 and 590:
Group 4: The agent is probably not
- Page 591 and 592:
TECHNICAL SUPPORT DOCUMENT FOR DESC
- Page 593 and 594:
US EPA IRIS Inhalation Unit Risk an
- Page 595 and 596:
TECHNICAL SUPPORT DOCUMENT FOR DESC
- Page 597 and 598:
as appropriate, and revise IRIS fil
- Page 599 and 600:
Chemical Exposure Route Study Type
- Page 601 and 602:
Chemical Exposure Route Study Type
- Page 603 and 604:
Chemical Exposure Route Study Type
- Page 605 and 606:
Methyl tert-butyl ether p. 5: Added


