PDF(2.7mb) - 國家政策研究基金會
PDF(2.7mb) - 國家政策研究基金會
PDF(2.7mb) - 國家政策研究基金會

Create successful ePaper yourself
Turn your PDF publications into a flip-book with our unique Google optimized e-Paper software.
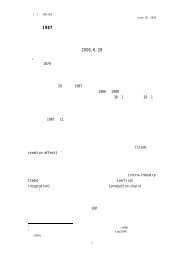
What’s Wrong with Taiwan’s Economy? Impact of Globalization 45<br />
Table 5. Changes in the employment of industries<br />
Unit<br />
2008<br />
2004 2005 2006 2007<br />
Sept. Oct.<br />
Agriculture, Forestry, Fishing & Animal Husbandry -6.70 -8.33 -5.38 -7.38 -1.71 -2.98<br />
Manufacturing 3.18 0.40 1.14 1.40 0.27 -0.39<br />
Food Manufacturing -0.01 0.68 1.30 1.96 -0.82 0.41<br />
Tobacco Manufacturing 0.20 -0.14 -1.77 -1.04 5.36 5.07<br />
Textiles Mills -1.15 -5.53 -4.32 -3.56 -4.92 -4.99<br />
Wearing Apparel & Clothing Accessories Manufacturing -4.65 -7.63 -5.46 -2.44 -1.46 -0.72<br />
Leather, Fur & Related Products Manufacturing -0.54 -4.94 -3.89 -2.35 -9.55 -7.64<br />
Wood & Bamboo Products Manufacturing 1.09 -0.27 -8.33 -2.74 -3.46 -3.83<br />
Furniture Manufacturing -4.22 -5.08 -1.86 -5.42 -7.36 -7.05<br />
Pulp, Paper & Paper Products Manufacturing 2.48 1.05 3.00 1.19 -3.74 -4.27<br />
Printing Products Manufacturing 0.10 -0.41 4.27 2.16 2.68 1.97<br />
Chemical Matter Manufacturing 1.21 -0.32 1.53 0.67 0.14 0.88<br />
Chemical Products Manufacturing 2.38 0.52 0.48 1.26 2.40 2.21<br />
Petroleum & Coal Products Manufacturing 2.62 2.01 -0.98 -1.04 -2.19 -1.94<br />
Rubber Products Manufacturing 3.15 -1.47 -0.43 1.73 0.52 -0.09<br />
Plastic Products Manufacturing 3.37 -1.19 -0.59 0.58 -2.17 -2.57<br />
Non-Metallic Mineral Products Manufacturing 0.22 0.44 1.24 1.28 -3.01 -4.47<br />
Basic Metal Manufacturing 1.78 2.01 2.57 2.19 2.12 2.08<br />
Fabricated Metal Products Manufacturing 4.52 -0.10 0.69 3.25 1.87 1.10<br />
Machinery & Equipments Manufacturing 5.81 4.70 3.12 4.71 0.82 -0.19<br />
Computers, Electronic & Optical Products Manufacturing 1.17 -1.72 1.51 1.23 -2.11 -3.95<br />
Electronic parts & Components Manufacturing 11.89 4.72 6.00 3.44 4.33 2.92<br />
Electrical Equipment Manufacturing 0.27 -0.54 -0.95 -1.18 3.62 3.30<br />
Transport Equipment Manufacturing 3.84 2.06 -1.33 -0.84 -0.49 -0.81<br />
Precision, Optical, health equipment, and watch manufacturing 1.08 -1.79 -0.61 -0.18 -2.32 -4.73<br />
Other Manufacturing 1.82 -1.19 -0.55 0.36 0.89 -0.17<br />
Electricity & Gas Supply -2.42 -1.51 -0.15 1.19 1.52 2.00<br />
Construction 0.06 2.80 1.74 1.92 1.70 -0.13<br />
Wholesale & Retail Trade 2.32 2.93 1.85 0.15 0.02 -0.56<br />
Accommodation & food services 7.09 3.75 3.93 2.38 4.18 4.34<br />
Transport, Storage & Communication 0.41 -0.63 -0.22 0.09 -0.43 -0.93<br />
Finance & Insurance 3.33 2.96 -0.34 1.19 -0.33 -0.68<br />
Real estate & leasing 5.98 6.04 5.91 5.64 1.78 2.10<br />
Professional, Scientific & Technical Services 8.08 6.61 4.64 4.08 6.20 5.86<br />
Human Health & Social Work Services 4.18 3.26 3.27 3.73 5.36 5.68<br />
Arts, Entertainment & Recreation -0.70 -0.97 -0.08 -0.05 -2.02 -2.35<br />
Other Services 7.13 4.22 6.06 9.52 6.77 5.80<br />
Source: Earnings and Productivity Statistics, DGBAS, Executive Yuan, R.O.C.