- Page 1 and 2:
NOHM RemediationServices Corp.WORK
- Page 3 and 4:
1.0 INTRODUCTIONThis Work Plan (WP)
- Page 5 and 6:
2.0 SITE BACKGROUNDMCB Camp Lejeune
- Page 7 and 8:
..;/II'. 1i4\..\1 '*.XCAVATION \.AR
- Page 9 and 10:
A I B I CE I PI 0 I H I IPARK I NGA
- Page 11 and 12:
OHM RemediationServices Corp. WORK
- Page 13 and 14:
5.0 SITE CONTROL PLANSOHM will impl
- Page 15 and 16: L= THE DISTANCE SUCH THAT POINTA AN
- Page 17 and 18: OHM RemediationServices Corp. WORK
- Page 19: OHMRemediationServices Corp. WORK P
- Page 22 and 23: OHM RemediationServices Corp. WORK
- Page 24 and 25: OHM RemediationServices Corp. WORK
- Page 26 and 27: 7.0 SITE RESTORATION AND DEMOBILIZA
- Page 28 and 29: 9.0 PROJECT SCHEDULEThe project sch
- Page 30 and 31: NOHM RemediationServices Corp.SAMPL
- Page 32 and 33: TABLE OF CONTENTS - CONTINUED6.0 DA
- Page 34 and 35: 2.0 PROJECT MANAGEMENT2.1 Project B
- Page 36 and 37: Program ManagerG. Krauter, P.E.Prog
- Page 38 and 39: OHM RemediationServices Corp. SAMPL
- Page 40 and 41: OHM RemediationServices Corp. SAMPL
- Page 42 and 43: OHM RemediationServices Corp. SAMPL
- Page 44 and 45: OHM RemediationServices Corp. SAMPL
- Page 46 and 47: OHM RemediationServices Corp. SAMPL
- Page 48 and 49: A I 8 I P I 0 I EFI I 6 IH1 IPARKIN
- Page 50 and 51: OHM RemediationServices Corp. SAMPL
- Page 52 and 53: OHM RemediationServices Corp. SAMPL
- Page 54 and 55: OHM RemediationServices Corp. SAMPL
- Page 56 and 57: OHM RemediationServices Corp. SAMPL
- Page 58 and 59: 4.0 DATA ACQUISITION4.1 Analytical
- Page 60 and 61: OHMRemediationl QC samples are with
- Page 62 and 63: OHM RemediationServices Corp. SAMPL
- Page 64 and 65: OHM RemediationServices Corp. SAMPL
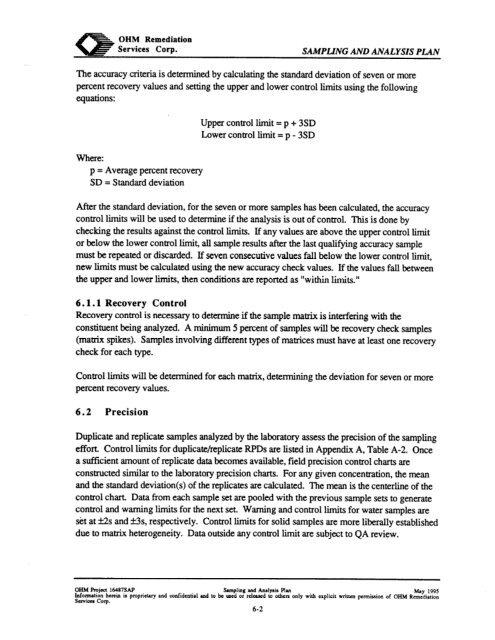
- Page 68 and 69: OHM RemediationServices Corp. SAMPL
- Page 70 and 71: lWorking order of instruments and e
- Page 72 and 73: 8.0 CORRECTIVE ACTIONCorrective act
- Page 74 and 75: OHM RemediationServices Corp. SAMPL
- Page 76 and 77: Table A-lSampling SummarySample Typ
- Page 78 and 79: Table A-lSampling SummarySample Typ
- Page 80 and 81: Table A-lSampling SummarySample Typ
- Page 82 and 83: Table A-lSampling SummarySample Typ
- Page 84 and 85: Table A-lSampling SummarySample Typ
- Page 86 and 87: AppendixBSample LabelCustody SealCh
- Page 88 and 89: 3 CHAIN-OF-CUSTODY RECORDOI IM Corp
- Page 90 and 91: IA== B OHM Renmhtionavices Corp\&FC
- Page 92 and 93: BOHM RemediationServices Corp.SITE-
- Page 94 and 95: TABLE OF CONTENTS - CONTINUED6.0 DE
- Page 96 and 97: This Health and Safety Plan (HASP)
- Page 98 and 99: _OHM RemediationServices Corp. HEAL
- Page 100 and 101: OHM RemediationServices Corp. HEALT
- Page 102 and 103: OHM RemediationServices Corp. HEALT
- Page 104 and 105: OHM RemediationServices Corp. HEALT
- Page 106 and 107: OHM RemediationServices Corp. HEALT
- Page 108 and 109: OHM RemediationServices Corp. HEALT
- Page 110 and 111: OHM RemediationServices Corp. HEALT
- Page 112 and 113: OHM RemediationServices Corp. HEALT
- Page 114 and 115: OHMRemediationconnection between th
- Page 116 and 117:
OHM RemediationServices Corp. HEALT
- Page 118 and 119:
OHMRemediationTask No. 4: SoilSampl
- Page 120 and 121:
OHM RemediationServices Corp. HEALT
- Page 122 and 123:
OHM RemediatioaServices Corp. HEALT
- Page 124 and 125:
5.0 PROTECTIVE EQUIPMENTThis sectio
- Page 126 and 127:
OHM RemediationServices Corp. HEALT
- Page 128 and 129:
6.0 DECONTAMINATION PROCEDURESThis
- Page 130 and 131:
. . . --..7.0 AIR MONITORINGAir mon
- Page 132 and 133:
OHM RemediationServices Corp. HEALT
- Page 134 and 135:
OHM RemediationServices Corp. HEALT
- Page 136 and 137:
OHM RemediationServices Corp. HEALT
- Page 138 and 139:
OHM RemediationServices Corp. HEALT
- Page 140 and 141:
OHM RemediationServices Corp. HEALT
- Page 142 and 143:
OHMRemediationServices Corp. HEALTH
- Page 144 and 145:
OHM RemediationServices Corp. HEALT
- Page 146 and 147:
OHM RemediationServices Corp. HEALT
- Page 148 and 149:
OHM RemediationServices Corp. HEALT
- Page 150 and 151:
ci@- OHM RemediationServices Corp.
- Page 152 and 153:
9.0 TRAINING REQUIREMENTSAs a prere
- Page 154 and 155:
OHM RemediationServices Corp. HEALT
- Page 156 and 157:
HEALTH-AND-SAFETYPLAN CERTlFICATION
- Page 158 and 159:
APPENDIX B - OHM HAZARD COMMUNICATI
- Page 160 and 161:
8. Know what you are expected to do
- Page 162 and 163:
. Methods and observations that may
- Page 164 and 165:
msPhysical propertiesAcute/Chronic
- Page 166 and 167:
GPI Material Safety Data Sheets Col
- Page 168 and 169:
Material Safety Data Sheets Collect
- Page 170 and 171:
e5P (518)37%8854Genium Publishing C
- Page 172 and 173:
apSix.lion 1. Material Identificati
- Page 174 and 175:
Material Safety Data Sheets Collect
- Page 176 and 177:
Genium Publishing CorporationMateri
- Page 178 and 179:
I, r.___Genium Publishing Corporati
- Page 180 and 181:
e.- -- _ - ------ -._-___ --._ ---.
- Page 182 and 183:
.UrRPLS= ?UXiURE OF PARAFFIHTC, CTt
- Page 184 and 185:
APPxavg a5twfIc vAPUR'C!fE?!XCAL CA
- Page 186 and 187:
Fi reNF?A HAZARD RATING ’- Extten
- Page 188 and 189:
WITCO MATERIAL SAFETY .O A T A SHEE
- Page 190:
. .c . ._. . . .. . . .# . . .. . .
- Page 193 and 194:
0.i1 -.-0.’ ,,’. .,‘A .,-“.
- Page 195 and 196:
IX Fhysial OataSan’ag,de.. ......
- Page 197 and 198:
-. - _ ___-. ----_-INGEzcizuIi tngu
- Page 199 and 200:
---------w.- -- ----F. FWSICAL DATA
- Page 201 and 202:
---.
- Page 203 and 204:
SECTION 5c- HEALTH HAZAROS4lllmsnol
- Page 205 and 206:
.--‘ AMALIE MULTI-PURPOSE LS GEAR
- Page 207 and 208:
We believe the statements, technica
- Page 209 and 210:
(Section III cmtinuei,)ffcsk=sint:
- Page 211 and 212:
““. m-. -I a-. -- ---- --- ----
- Page 213 and 214:
i:.:::;:. ..-., \,’. .No. 68 Calc
- Page 215 and 216:
HATZ:P~A&,SXFETY DATA SHEET NC?. CO
- Page 217 and 218:
.w.N/AHAZAROOUS MIXTURES OF OTHER L
- Page 219 and 220:
.._ s1\1a.lZPage 4CHEMICAL FORMULA:
- Page 221 and 222:
. .SECTION 6. HEXLTH HAZARD. IfiFOR
- Page 223 and 224:
AJ 0. 14MSDS No. 324 Isopropyl Alco
- Page 225 and 226:
No. 14MSDS No. 324 Isopropyl Alcoho
- Page 227 and 228:
.;, -.-:-..: ..INo.44 Methane 8A9__
- Page 229:
. Materiaf Safety Data SheetFrom Gc
- Page 232 and 233:
:.I3 FlRsrBRANDSMaterial Safety Dat
- Page 234 and 235:
.nFIRSTBRANDSMaterial Safety Data S
- Page 236 and 237:
.. . DFIRSTBRANIlSMaterial Safety D
- Page 238 and 239:
Tdeshone:Infomation: (619) 275liu~C
- Page 240 and 241:
APPENDIXDHEALTH AND SAFETY FORMSAcc
- Page 242 and 243:
(Use Extra Pageif Needed).--%scribo
- Page 244 and 245:
*c= OH31 Remediation\m Services Cor
- Page 246 and 247:
IBAR MONTHLY INSbBCTIONCHECRLIBTBAR
- Page 248 and 249:
alme,-I sowica Corp.COMBUS’ITBLE
- Page 250 and 251:
DIRECT READING INSTUMENT LOGNAME:PR
- Page 252 and 253:
j% - -5 mi -omcorpo~Date:DAILY SA.F
- Page 254 and 255:
. ‘ISCUA MONIIILY INSFECA'ION CIi
- Page 256 and 257:
SITE SAFETY OFFICERDAILY REPORTDATE
- Page 258 and 259:
~.-’ - . .-Pm-.. -d-e..-L ArtEre
- Page 260 and 261:
----------t.------------m----------
- Page 262 and 263:
HAZARD ANALYSISEM 38s i1 Ott 92nLll


