- Page 1 and 2:
Governing the City StateOne ACT Gov
- Page 3 and 4:
LETTER OF TRANSMITTALMr Jon Stanhop
- Page 7 and 8:
CONTENTSEXECUTIVE SUMMARY .........
- Page 9 and 10:
Doing Whole of Government in the AC
- Page 11 and 12:
Proposed Changes...................
- Page 13 and 14:
Investing in Capability ...........
- Page 15 and 16:
Acronyms and Short Forms Used in th
- Page 17 and 18:
EXECUTIVE SUMMARYIn September 2010,
- Page 19 and 20:
There are nevertheless areas that r
- Page 21 and 22:
The Administrative ArrangementsWith
- Page 23 and 24:
5. Amend the Public Sector Manageme
- Page 25 and 26:
24. Strategic Board outcomes be pro
- Page 27 and 28:
Department of Justice andCommunity
- Page 29 and 30:
Figure 1 - Current and Proposed Str
- Page 31 and 32:
Chief Minister’s Finance Economic
- Page 33 and 34:
Figure 2 - Structure optionsOption
- Page 35 and 36:
Priority SettingThe Review recommen
- Page 37 and 38:
55. Improve workforce data quality
- Page 39 and 40:
CHAPTER ONE: BACKGROUND TO THE REVI
- Page 41 and 42:
Guiding Principles - Embracing Uniq
- Page 43 and 44:
imperatives, improvements to system
- Page 45 and 46:
CHAPTER TWO: CONTEXT FOR THE REVIEW
- Page 47 and 48:
capacity of the Commonwealth Execut
- Page 49 and 50:
Table 1 - Elected Members at Each L
- Page 51 and 52:
The ACT in 1989 and 2010PopulationI
- Page 53 and 54:
Figure 5 - Settlement and New Centr
- Page 55 and 56:
Canberra in 2010 - a Snapshot• Th
- Page 57 and 58:
In addition to the RLF and its rela
- Page 59 and 60:
• disability officers (43.9 years
- Page 61 and 62:
Figure 9 - Sources of ACT Governmen
- Page 63 and 64:
Table 6 - General Government Sector
- Page 65 and 66:
looming risks to revenue, which wil
- Page 67 and 68:
• the development of a city which
- Page 69 and 70:
CHAPTER THREE: GOVERNING THE CITY S
- Page 71 and 72:
commitment to an open, accountable,
- Page 73 and 74:
This form of Committee meeting woul
- Page 75 and 76:
and cooperative relationships betwe
- Page 77 and 78:
Australia, should be capable of sig
- Page 79 and 80:
with respect to the relationship be
- Page 81 and 82:
undertaken, and the roles participa
- Page 83 and 84:
These risks can be overcome through
- Page 85 and 86:
specific policy areas where it is t
- Page 87 and 88:
Despite its inherent appeal to comm
- Page 89 and 90:
- and enhance its capacity to provi
- Page 91 and 92:
Apples and Oranges - the ACTPS and
- Page 93 and 94:
safer and stronger - helping commun
- Page 95 and 96:
The ACT's progress is measured by 2
- Page 97 and 98:
coordination of action. To function
- Page 99 and 100:
Many of the benefits of the single
- Page 101 and 102:
priorities and see new ways for COA
- Page 104 and 105:
Citizen’s dealings with the ACT G
- Page 106 and 107:
Canberra suggests, for example, tha
- Page 108 and 109:
community through the proactive use
- Page 110 and 111:
innovative ACTPS. Fundamental to th
- Page 112 and 113:
times, the operation of COAG has se
- Page 114 and 115:
Indeed, in playing its proper role,
- Page 116 and 117:
members (where they exist). Overall
- Page 118 and 119:
Figure 13 - The Public Interest Map
- Page 120 and 121:
Just because an official is exercis
- Page 122 and 123:
Appendix 1 - Sample of ACT Governme
- Page 124 and 125:
The Administrative ArrangementsThe
- Page 126 and 127:
• creating the Sustainable Develo
- Page 128 and 129:
Department of Treasury • See Chie
- Page 130 and 131:
• maintain the Shared Services Go
- Page 132 and 133:
Chief Minister’s Department(Optio
- Page 134 and 135:
The most influential aggregation of
- Page 136 and 137:
The role of the proposed Chief Mini
- Page 138 and 139:
through ACT Government reporting pr
- Page 140 and 141:
community events and major economic
- Page 142 and 143:
This approach is sound and reflects
- Page 144 and 145:
Policies, procedures and guidelines
- Page 146 and 147:
Triple Bottom Line sustainability p
- Page 148 and 149:
subsequent years the Infrastructure
- Page 150 and 151:
Unions ACT noted in its Submission
- Page 152 and 153:
While there is clearly a need to en
- Page 154 and 155:
As part of this work, the Review re
- Page 156 and 157:
across the ACTPS. Significant impro
- Page 158 and 159:
Independent Competition and Regulat
- Page 160 and 161:
Department of Justice and Community
- Page 162 and 163:
accreditation, dispute resolution a
- Page 164 and 165:
function as part of the Office for
- Page 166 and 167:
The Review also notes work to achie
- Page 168 and 169:
ACT Health(Health Directorate - Min
- Page 170 and 171:
Significant whole of government, co
- Page 172 and 173:
Minister forChildren and YoungPeopl
- Page 174 and 175:
The Social Compact establishes a Jo
- Page 176 and 177:
quality of data about Aboriginal an
- Page 178 and 179:
Department of Education and Trainin
- Page 180 and 181:
It is interesting to note in this c
- Page 182 and 183:
profitable courses in one area dimi
- Page 184 and 185:
Department of Territory and Municip
- Page 186 and 187:
Proposed ChangesThe Review recommen
- Page 188 and 189:
TAMS has already made advances in t
- Page 190 and 191:
PCL’s role extends to fire fighti
- Page 192 and 193:
IssuesSupport to the Conservator fo
- Page 194 and 195:
FunctionsClimate change policyEnerg
- Page 196 and 197:
Clearly there is a place in every p
- Page 198 and 199:
LDA was praised for its central rol
- Page 200 and 201:
(l) to provide planning services, i
- Page 202 and 203:
There is a high level of inefficien
- Page 204 and 205:
IssuesCOAG’s National Criteria fo
- Page 206 and 207:
• The linkages between service pr
- Page 208 and 209:
we envisage such a group, probably
- Page 210 and 211:
o Completion Bond - Bond taken as s
- Page 212 and 213:
In responding to the recently compl
- Page 214 and 215:
Business SupportThrough the course
- Page 216 and 217:
Land developmentLand releaseMajor l
- Page 218 and 219:
they discharge their responsibiliti
- Page 220 and 221:
CHAPTER FIVE: STRATEGY, RESOURCE AL
- Page 222 and 223:
number, and there was a greater ali
- Page 224 and 225:
adversary or attaining an end”, a
- Page 226 and 227:
At the core of this scenario planni
- Page 228 and 229:
concrete activities and areas of fo
- Page 230 and 231:
attempt to align streams of reporti
- Page 232 and 233:
• Capital Development is the ACT
- Page 234 and 235:
consultations with staff that they
- Page 236 and 237:
Much of this coordination work in w
- Page 238 and 239:
objectives contribute to the priori
- Page 240 and 241:
central direction in developing the
- Page 242 and 243:
desires of the Legislature to scrut
- Page 244 and 245:
Performance and Accountability in t
- Page 246 and 247:
The performance and accountability
- Page 248 and 249:
• conducting evaluations to a hig
- Page 250 and 251:
argued and accurately costed in a t
- Page 252 and 253:
A more significant improvement woul
- Page 254 and 255:
Performance and Accountability and
- Page 256 and 257:
Strategy, Resource Allocation and t
- Page 258 and 259:
too long. There is clearly an unwil
- Page 260 and 261:
The modelling of these values is mo
- Page 262 and 263:
To complement the existing work exe
- Page 264 and 265:
policy?Averaged rating (equallyweig
- Page 266 and 267:
• the greater likelihood of a nar
- Page 268 and 269:
The Auditor-General has recently ta
- Page 270 and 271:
• workplace health and safety tra
- Page 272 and 273:
of officials to tackle critical iss
- Page 274 and 275:
The Review recommends establishment
- Page 276 and 277:
Responding to the fiscal pressures
- Page 278 and 279:
Workplace culture in the ACT Parlia
- Page 280 and 281:
explored. With the help of benchmar
- Page 282 and 283:
Continuing to provide employees wit
- Page 284 and 285:
There is an increasing need for Ser
- Page 286 and 287:
… finding this ‘space’ [to in
- Page 288 and 289:
Figure 20 - Dimensions of Innovatio
- Page 290 and 291:
the past, limitations on external c
- Page 292 and 293:
• better information sharing to s
- Page 294 and 295:
The plethora of approaches to encou
- Page 296 and 297:
Figure 22 - Innovation CycleRecomme
- Page 298 and 299:
The legislative employment framewor
- Page 300 and 301:
Unions expressed frustration to the
- Page 302 and 303:
extend to matters of remuneration a
- Page 304 and 305:
• Develop the strategic human res
- Page 306 and 307:
Recommendation: Governance• the p
- Page 308 and 309:
ameliorate such issues, this is not
- Page 310 and 311:
Recommendation: Shared Services•
- Page 312 and 313: This led the Commission to define s
- Page 314 and 315: The second model represents each sp
- Page 316 and 317: The consultation process referred t
- Page 318 and 319: Suggestions:• the sustainability
- Page 320 and 321: taking up to four years. ‘Plannin
- Page 322 and 323: the release of residential land. As
- Page 324 and 325: house prices. Among the actions tar
- Page 326 and 327: The usual model is that Commonwealt
- Page 328 and 329: Canberra also has an extensive walk
- Page 330 and 331: ACTION staff and management are acu
- Page 332 and 333: suggests that it may not be so. Con
- Page 334 and 335: • unless the industrial framework
- Page 336 and 337: Green CabsMany countries are embrac
- Page 338 and 339: modules, each with a lead senior ex
- Page 340 and 341: Dashboard ReportingThe attached tem
- Page 342 and 343: ATTACHMENT A: CHIEF MINISTER’S PR
- Page 344 and 345: ATTACHMENT B: CONSULTATIONConsultat
- Page 346 and 347: Meetings held by the Reviewer• AH
- Page 348 and 349: • RATTENBURY, Shane - Speaker, AC
- Page 350 and 351: BIBLIOGRAPHYACT Auditor-General (20
- Page 352 and 353: Australian Public Service Commissio
- Page 354 and 355: Evans, M. (2009) “Gordon Brown an
- Page 356 and 357: Mulgan, R. (2002) “Accountability
- Page 358 and 359: South Australian Performance Commis
- Page 360 and 361: Williams, G. (2010) “Euthanasia B


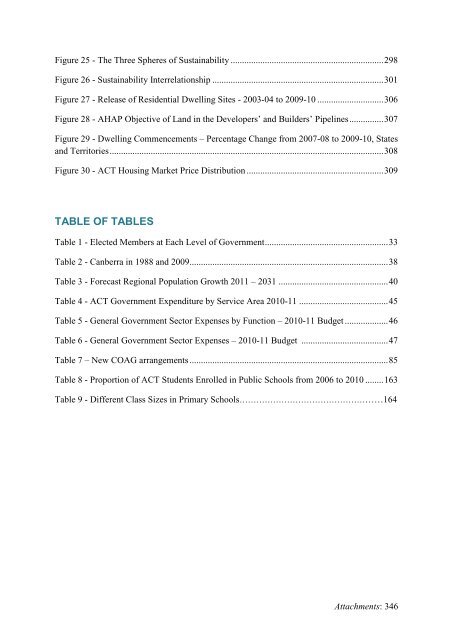

![HSR Training Programs Guidelines [ PDF 191KB]](https://img.yumpu.com/51348280/1/190x245/hsr-training-programs-guidelines-pdf-191kb.jpg?quality=85)




![Teachers Technical and Further Education [ PDF 68KB]](https://img.yumpu.com/34230751/1/184x260/teachers-technical-and-further-education-pdf-68kb.jpg?quality=85)
