Reproduction in Domestic Animals
Reproduction in Domestic Animals
Reproduction in Domestic Animals
- No tags were found...

Create successful ePaper yourself
Turn your PDF publications into a flip-book with our unique Google optimized e-Paper software.
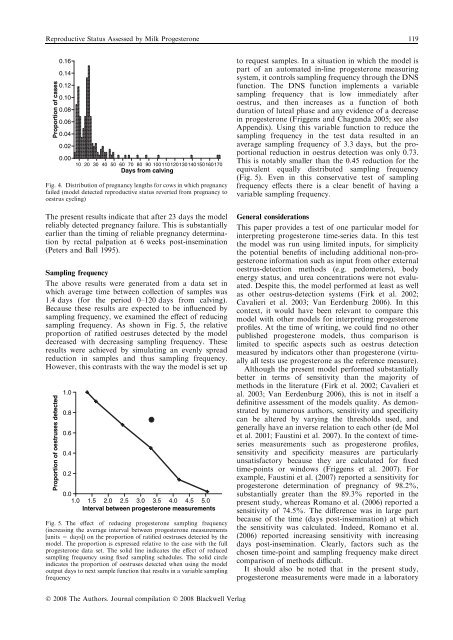
Reproductive Status Assessed by Milk Progesterone 119Proportion of cases0.160.140.120.100.080.060.040.020.0010 20 30 40 50 60 70 80 90 100110120130140150160170Days from calv<strong>in</strong>gFig. 4. Distribution of pregnancy lengths for cows <strong>in</strong> which pregnancyfailed (model detected reproductive status reverted from pregnancy tooestrus cycl<strong>in</strong>g)The present results <strong>in</strong>dicate that after 23 days the modelreliably detected pregnancy failure. This is substantiallyearlier than the tim<strong>in</strong>g of reliable pregnancy determ<strong>in</strong>ationby rectal palpation at 6 weeks post-<strong>in</strong>sem<strong>in</strong>ation(Peters and Ball 1995).Sampl<strong>in</strong>g frequencyThe above results were generated from a data set <strong>in</strong>which average time between collection of samples was1.4 days (for the period 0–120 days from calv<strong>in</strong>g).Because these results are expected to be <strong>in</strong>fluenced bysampl<strong>in</strong>g frequency, we exam<strong>in</strong>ed the effect of reduc<strong>in</strong>gsampl<strong>in</strong>g frequency. As shown <strong>in</strong> Fig. 5, the relativeproportion of ratified oestruses detected by the modeldecreased with decreas<strong>in</strong>g sampl<strong>in</strong>g frequency. Theseresults were achieved by simulat<strong>in</strong>g an evenly spreadreduction <strong>in</strong> samples and thus sampl<strong>in</strong>g frequency.However, this contrasts with the way the model is set upProportion of oestruses detected1.00.80.60.40.20.01.0 1.5 2.0 2.5 3.0 3.5 4.0 4.5 5.0Interval between progesterone measurementsFig. 5. The effect of reduc<strong>in</strong>g progesterone sampl<strong>in</strong>g frequency(<strong>in</strong>creas<strong>in</strong>g the average <strong>in</strong>terval between progesterone measurements[units = days]) on the proportion of ratified oestruses detected by themodel. The proportion is expressed relative to the case with the fullprogesterone data set. The solid l<strong>in</strong>e <strong>in</strong>dicates the effect of reducedsampl<strong>in</strong>g frequency us<strong>in</strong>g fixed sampl<strong>in</strong>g schedules. The solid circle<strong>in</strong>dicates the proportion of oestruses detected when us<strong>in</strong>g the modeloutput days to next sample function that results <strong>in</strong> a variable sampl<strong>in</strong>gfrequencyto request samples. In a situation <strong>in</strong> which the model ispart of an automated <strong>in</strong>-l<strong>in</strong>e progesterone measur<strong>in</strong>gsystem, it controls sampl<strong>in</strong>g frequency through the DNSfunction. The DNS function implements a variablesampl<strong>in</strong>g frequency that is low immediately afteroestrus, and then <strong>in</strong>creases as a function of bothduration of luteal phase and any evidence of a decrease<strong>in</strong> progesterone (Friggens and Chagunda 2005; see alsoAppendix). Us<strong>in</strong>g this variable function to reduce thesampl<strong>in</strong>g frequency <strong>in</strong> the test data resulted <strong>in</strong> anaverage sampl<strong>in</strong>g frequency of 3.3 days, but the proportionalreduction <strong>in</strong> oestrus detection was only 0.73.This is notably smaller than the 0.45 reduction for theequivalent equally distributed sampl<strong>in</strong>g frequency(Fig. 5). Even <strong>in</strong> this conservative test of sampl<strong>in</strong>gfrequency effects there is a clear benefit of hav<strong>in</strong>g avariable sampl<strong>in</strong>g frequency.General considerationsThis paper provides a test of one particular model for<strong>in</strong>terpret<strong>in</strong>g progesterone time-series data. In this testthe model was run us<strong>in</strong>g limited <strong>in</strong>puts, for simplicitythe potential benefits of <strong>in</strong>clud<strong>in</strong>g additional non-progesterone<strong>in</strong>formation such as <strong>in</strong>put from other externaloestrus-detection methods (e.g. pedometers), bodyenergy status, and urea concentrations were not evaluated.Despite this, the model performed at least as wellas other oestrus-detection systems (Firk et al. 2002;Cavalieri et al. 2003; Van Eerdenburg 2006). In thiscontext, it would have been relevant to compare thismodel with other models for <strong>in</strong>terpret<strong>in</strong>g progesteroneprofiles. At the time of writ<strong>in</strong>g, we could f<strong>in</strong>d no otherpublished progesterone models, thus comparison islimited to specific aspects such as oestrus detectionmeasured by <strong>in</strong>dicators other than progesterone (virtuallyall tests use progesterone as the reference measure).Although the present model performed substantiallybetter <strong>in</strong> terms of sensitivity than the majority ofmethods <strong>in</strong> the literature (Firk et al. 2002; Cavalieri etal. 2003; Van Eerdenburg 2006), this is not <strong>in</strong> itself adef<strong>in</strong>itive assessment of the models quality. As demonstratedby numerous authors, sensitivity and specificitycan be altered by vary<strong>in</strong>g the thresholds used, andgenerally have an <strong>in</strong>verse relation to each other (de Molet al. 2001; Faust<strong>in</strong>i et al. 2007). In the context of timeseriesmeasurements such as progesterone profiles,sensitivity and specificity measures are particularlyunsatisfactory because they are calculated for fixedtime-po<strong>in</strong>ts or w<strong>in</strong>dows (Friggens et al. 2007). Forexample, Faust<strong>in</strong>i et al. (2007) reported a sensitivity forprogesterone determ<strong>in</strong>ation of pregnancy of 98.2%,substantially greater than the 89.3% reported <strong>in</strong> thepresent study, whereas Romano et al. (2006) reported asensitivity of 74.5%. The difference was <strong>in</strong> large partbecause of the time (days post-<strong>in</strong>sem<strong>in</strong>ation) at whichthe sensitivity was calculated. Indeed, Romano et al.(2006) reported <strong>in</strong>creas<strong>in</strong>g sensitivity with <strong>in</strong>creas<strong>in</strong>gdays post-<strong>in</strong>sem<strong>in</strong>ation. Clearly, factors such as thechosen time-po<strong>in</strong>t and sampl<strong>in</strong>g frequency make directcomparison of methods difficult.It should also be noted that <strong>in</strong> the present study,progesterone measurements were made <strong>in</strong> a laboratoryÓ 2008 The Authors. Journal compilation Ó 2008 Blackwell Verlag