Report from the Sub-comittee on the environment and health
Report from the Sub-comittee on the environment and health
Report from the Sub-comittee on the environment and health

Create successful ePaper yourself
Turn your PDF publications into a flip-book with our unique Google optimized e-Paper software.
38<br />
Bromoxynil 3 n.d. 0.04 54<br />
DNOC 4 n.d. 0.02 82<br />
Dichloroprop 2 2 1.4 82<br />
Dinoseb 1 n.d. 0.01 82<br />
Ioxynil n.d. n.d. n.d. 54<br />
MCPA 4 3 0.17 82<br />
Mechlorprop 3 3 0.17 82<br />
Metazachlor n.d. n.d. n.d. 21<br />
Alachlor n.d. n.d. n.d. 21<br />
Ethylene thiourea M (ETU) n.d. 2 0.34 28<br />
n.d. = not detected<br />
M = metabolites<br />
Italics = substances authorised in 1998, possibly with dispensati<strong>on</strong><br />
µg/L = microgramme per litre<br />
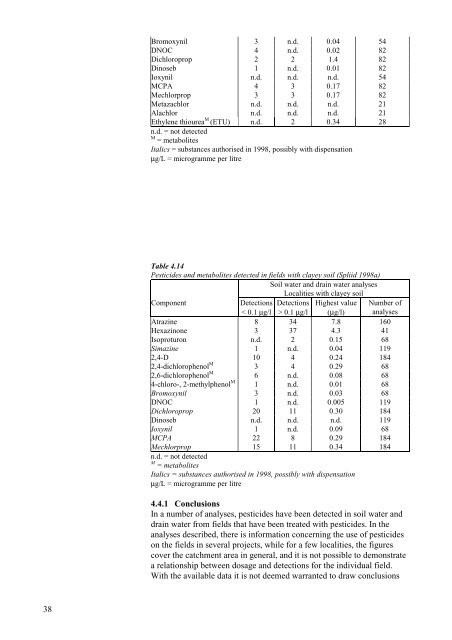
Table 4.14<br />
Pesticides <strong>and</strong> metabolites detected in fields with clayey soil (Spliid 1998a)<br />
Soil water <strong>and</strong> drain water analyses<br />
Localities with clayey soil<br />
Comp<strong>on</strong>ent Detecti<strong>on</strong>s Detecti<strong>on</strong>s Highest value Number of<br />
< 0.1 µg/l > 0.1 µg/l (µg/l) analyses<br />
Atrazine 8 34 7.8 160<br />
Hexazin<strong>on</strong>e 3 37 4.3 41<br />
Isoprotur<strong>on</strong> n.d. 2 0.15 68<br />
Simazine 1 n.d. 0.04 119<br />
2,4-D 10 4 0.24 184<br />
2,4-dichlorophenol M<br />
3 4 0.29 68<br />
2,6-dichlorophenol M<br />
6 n.d. 0.08 68<br />
4-chloro-, 2-methylphenol M<br />
1 n.d. 0.01 68<br />
Bromoxynil 3 n.d. 0.03 68<br />
DNOC 1 n.d. 0.005 119<br />
Dichloroprop 20 11 0.30 184<br />
Dinoseb n.d. n.d. n.d. 119<br />
Ioxynil 1 n.d. 0.09 68<br />
MCPA 22 8 0.29 184<br />
Mechlorprop 15 11 0.34 184<br />
n.d. = not detected<br />
M = metabolites<br />
Italics = substances authorised in 1998, possibly with dispensati<strong>on</strong><br />
µg/L = microgramme per litre<br />
4.4.1 C<strong>on</strong>clusi<strong>on</strong>s<br />
In a number of analyses, pesticides have been detected in soil water <strong>and</strong><br />
drain water <str<strong>on</strong>g>from</str<strong>on</strong>g> fields that have been treated with pesticides. In <str<strong>on</strong>g>the</str<strong>on</strong>g><br />
analyses described, <str<strong>on</strong>g>the</str<strong>on</strong>g>re is informati<strong>on</strong> c<strong>on</strong>cerning <str<strong>on</strong>g>the</str<strong>on</strong>g> use of pesticides<br />
<strong>on</strong> <str<strong>on</strong>g>the</str<strong>on</strong>g> fields in several projects, while for a few localities, <str<strong>on</strong>g>the</str<strong>on</strong>g> figures<br />
cover <str<strong>on</strong>g>the</str<strong>on</strong>g> catchment area in general, <strong>and</strong> it is not possible to dem<strong>on</strong>strate<br />
a relati<strong>on</strong>ship between dosage <strong>and</strong> detecti<strong>on</strong>s for <str<strong>on</strong>g>the</str<strong>on</strong>g> individual field.<br />
With <str<strong>on</strong>g>the</str<strong>on</strong>g> available data it is not deemed warranted to draw c<strong>on</strong>clusi<strong>on</strong>s