- Page 1 and 2:
1° Rapporto sullo Stato dell’Amb
- Page 3 and 4:
INDICE INTRODUZIONE 1 1 - PARTE PRI
- Page 5 and 6:
2 - PARTE SECONDA - LA SOSTENIBILIT
- Page 7 and 8:
2.7.3 Consistenza del parco veicola
- Page 9 and 10:
Introduzione Lo Sviluppo Sostenibil
- Page 11 and 12:
Per raggiungere lo sviluppo sosteni
- Page 13 and 14:
Il miglioramento (o il peggiorament
- Page 15 and 16:
DETERMINANTI • agricoltura • in
- Page 17 and 18:
delle attività economiche. Nella s
- Page 19 and 20:
Fig. 1.1.1 - Veduta della città di
- Page 21 and 22:
Fig. 1.2.1 - Distribuzione delle ti
- Page 23 and 24:
Il Programma CORINE (Coordination o
- Page 25 and 26:
1.2.2 Geologia, Idrogeologia e Idro
- Page 27 and 28:
s.l.m.), passando per contrada Le M
- Page 29 and 30:
La temperatura media annua nel peri
- Page 31 and 32:
Fig. 1.2.7 - Carta fitoclimatica (F
- Page 33 and 34:
Fig. 1.2.8 - Alisma plantago acquat
- Page 35 and 36:
Fig.1.2.12 - Crataegus monogyna Fon
- Page 37 and 38:
Fig. 1.2.15 - Erinaceus europaeus F
- Page 39 and 40:
- Aziende faunistico-venatorie; - Z
- Page 41 and 42: Fig. 1.2.21 - Piano Faunistico Vena
- Page 43 and 44: La dimensione delle 20.000 presenze
- Page 45 and 46: Fig1.3.4 - Evoluzione della densit
- Page 47 and 48: Fig. 1.3.6 - Principali indici demo
- Page 49 and 50: Popolazione straniera Gli stranieri
- Page 51 and 52: Fig. 1.3.8 - Distribuzione percentu
- Page 53 and 54: 1.3.3 Criminalità Dal monitoraggio
- Page 55 and 56: In secondo luogo, andando ad analiz
- Page 57 and 58: appartenente alle forze di lavoro e
- Page 59 and 60: 1.4 - L’URBANIZZAZIONE, LE STRUTT
- Page 61 and 62: Tab. 1.4.2 - Quadro sintetico degli
- Page 63 and 64: ovvero L.R. 24 del 6.7.1998", rigua
- Page 65 and 66: - dalle norme tecniche modificate e
- Page 67 and 68: Nella stessa zona Nord si sviluppa
- Page 69 and 70: Tab. 1.4.5 - Zonizzazione del Comun
- Page 71 and 72: Per quanto riguarda la pianificazio
- Page 73 and 74: Fig. 1.4.2 - Ripartizione del numer
- Page 75 and 76: Per completare il quadro, si può a
- Page 77 and 78: Tab. 1.5.1 - Numero di imprese, ist
- Page 79 and 80: Tab. 1.5.2 - Numero di imprese per
- Page 81 and 82: Fig. 1.5.7 - Percentuale di unità
- Page 83 and 84: Tab. 1.5.3 - Rapporto addetti /popo
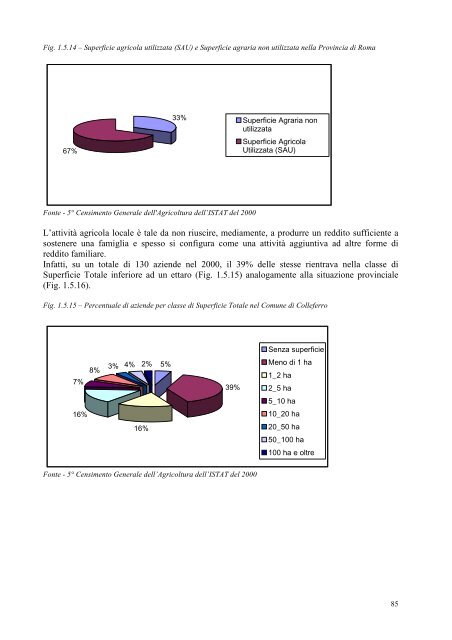
- Page 85 and 86: Fig. 1.5.11 - Percentuale delle imp
- Page 87 and 88: Tab. 1.5.10 - Dotazione imprenditor
- Page 89 and 90: Camere di Commercio, gli alloggi ag
- Page 91: dell'ambiente e con la cura dello s
- Page 95 and 96: Fig. 1.5.18 - Percentuale di aziend
- Page 97 and 98: - boschi. Ognuna di queste coltivaz
- Page 99 and 100: I dati comunali si differenziavano
- Page 101 and 102: Tab. 1.5.15 - Numero di aziende con
- Page 103 and 104: Tab. 1.5.16 - Fitofarmaci vendute n
- Page 105 and 106: Fig. 1.5.30 - Differenza % tra il 2
- Page 107 and 108: Tab. 1.5.20 - Numero di aziende per
- Page 109 and 110: - D. Lgs. 19 settembre 1994, n. 626
- Page 111 and 112: creare, gli impatti sull’ambiente
- Page 113 and 114: 1.5.4 Il commercio e l'artigianato
- Page 115 and 116: Tab. 1.5.23 - Esercizi di vicinato
- Page 117 and 118: Tab. 1.5.26 - Centro Commerciale
- Page 119 and 120: Tab. 1.5.28 - Numero di imprese art
- Page 121 and 122: Tab. 1.5.32 - Scheda dell’ampliam
- Page 123 and 124: 1.5.6 Diffusione dei sistemi di ges
- Page 125 and 126: 2 - PARTE SECONDA - LA SOSTENIBILIT
- Page 127 and 128: metropolitani e rappresentano una p
- Page 129 and 130: estensione adatta a garantire la di
- Page 131 and 132: Quello che emerge da questa analisi
- Page 133 and 134: Habitat standard Il confronto dell
- Page 135 and 136: Diversità L’indice di Shannon (H
- Page 137 and 138: 2.2.1 Sensibilità del territorio a
- Page 139 and 140: Fig. 2.2.1 - Numero degli eventi di
- Page 141 and 142: edazione di piani e direttive per l
- Page 143 and 144:
Fig. 2.2.7 - Densità dei siti colp
- Page 145 and 146:
Fig 2.2.9 - Probabilità totali (fr
- Page 147 and 148:
Fig. 2.2.12 - Frane presenti sul te
- Page 149 and 150:
• dimensioni dell'area contaminat
- Page 151 and 152:
Roma ed il Ministero dell’Ambient
- Page 153 and 154:
Analisi per il Termovalorizzatore U
- Page 155 and 156:
Tab. 2.2.9 - Valori delle concentra
- Page 157 and 158:
Tab 2.2.11 - Valori delle concentra
- Page 159 and 160:
2.3.1 Normativa L’attuale legisla
- Page 161 and 162:
Tab. 2.3.2 - Classi di qualità del
- Page 163 and 164:
Tab. 2.3.6 - Valori SECA per le sta
- Page 165 and 166:
L’Arpa riscontrò, nell’ambito
- Page 167 and 168:
Fig. 2.3.2 - Risultati dell’indag
- Page 169 and 170:
Tab. 2.3.7 - Classificazione dei co
- Page 171 and 172:
• Pozzo n.10 denominato Colle Sug
- Page 173 and 174:
parametri del vecchio decreto sono
- Page 175 and 176:
Tab. 2.3.10 - Confronto tra valori
- Page 177 and 178:
2.3.5 Carico inquinante totale per
- Page 179 and 180:
Popolazione Industria SAU Incolto A
- Page 181 and 182:
Il D.Lgs. 152/99 prevedeva che gli
- Page 183 and 184:
2.3.6 I fabbisogni idrici La propos
- Page 185 and 186:
Tab. 2.3.19 - Prospetto dei fabbiso
- Page 187 and 188:
2.4. - LA QUALITA’ DELL’ARIA L
- Page 189 and 190:
• le polveri: sono particelle sol
- Page 191 and 192:
Tab. 2.4.2 - Valori limite previsti
- Page 193 and 194:
Un po’ di definizioni Secondo il
- Page 195 and 196:
ilevazione delle situazioni di inqu
- Page 197 and 198:
ambientale, per capire quanto la si
- Page 199 and 200:
Tab. 2.4.5 - Indicatori di stato de
- Page 201 and 202:
2.4.4 Le emissioni Emissioni nel co
- Page 203 and 204:
• una cava; • produzione di arm
- Page 205 and 206:
2.4.5 Le politiche del Comune di Co
- Page 207 and 208:
Fig.2.4.7: Valori di concentrazione
- Page 209 and 210:
2.5 INQUINAMENTO ELETTROMAGNETICO L
- Page 211 and 212:
2.5.1 Normativa La regolamentazione
- Page 213 and 214:
2.5.2 Stazioni Radio Base (SRB) All
- Page 215 and 216:
2.5.4 Numero degli esposti presenta
- Page 217 and 218:
• le condizioni microclimatiche.
- Page 219 and 220:
Tutti i Comuni sono tenuti a stilar
- Page 221 and 222:
2.6.2 Pianificazione e stato di att
- Page 223 and 224:
Figura 2.6.1 - Carta del Piano di Z
- Page 225 and 226:
2.6.3 Il parco veicolare e l’inqu
- Page 227 and 228:
2.7.1 Normativa Si riportano di seg
- Page 229 and 230:
Tali criticità sono note e vi sono
- Page 231 and 232:
Fig. 2.7.1 - Consistenza del parco
- Page 233 and 234:
Tab. 2.7.4 - Autovetture circolanti
- Page 235 and 236:
medio italiano (4,4%). Sarebbe inte
- Page 237 and 238:
Tab. 2.7.8 - Incidentalità nel Com
- Page 239 and 240:
Completamento delle infrastrutture
- Page 241 and 242:
2.8 ENERGIA Secondo l’Agenda 21 e
- Page 243 and 244:
modificazioni avvenute nel settore
- Page 245 and 246:
2.9 RIFIUTI Negli ultimi decenni l
- Page 247 and 248:
2.9.1 Normativa Il Decreto Ronchi h
- Page 249 and 250:
4. Nell'attività di gestione dei r
- Page 251 and 252:
- garantire metodiche di raccolta c
- Page 253 and 254:
Discarica per rifiuti pericolosi: o
- Page 255 and 256:
2.9.3 Raccolta Differenziata (RD) L
- Page 257 and 258:
2.9.4 Influenza del Comune nell’a
- Page 259 and 260:
Fig. 2.9.5 - Percentuale dei rifiut
- Page 261 and 262:
Fig. 2.9.6 - Discarica di Colle fag
- Page 263 and 264:
Fig. 2.9.7 - Sequenza di trattament
- Page 265 and 266:
Tab. 2.9.4 - Caratteristiche tecnic
- Page 267 and 268:
2.9.7 Interventi per la valorizzazi
- Page 269 and 270:
2.10 RISCHI NATURALI E ANTROPICI Pe
- Page 271 and 272:
Fig. 2.10.1 - Riclassificazione sis
- Page 273 and 274:
2.10.2 Radon Il radon è un element
- Page 275 and 276:
2.10.3 Amianto L’amianto (che rap
- Page 277 and 278:
• INDUSTRIE CHIMICHE CAFFARO S.r.
- Page 279 and 280:
3.1.1 Istruzione Il D.Lgs 59/2004 e
- Page 281 and 282:
Sono due dei servizi comunali più
- Page 283 and 284:
2. una serie di apparecchi che illu
- Page 285 and 286:
gratuitamente al corso di formazion
- Page 287 and 288:
Colleferro presiede al Distretto RM
- Page 289 and 290:
− le potenzialità e gli eventual
- Page 291 and 292:
− scienza e metafisica; − labor
- Page 293 and 294:
3.1.5 Sport Nel Comune di Colleferr
- Page 295 and 296:
3.1.6 Manifestazioni ed eventi Dal
- Page 297 and 298:
3.1.7 Interventi per la promozione
- Page 299 and 300:
BIBLIOGRAFIA E DOCUMENTAZIONE DI RI
- Page 301 and 302:
- AA.VV. - 2002- Piano Territoriale
- Page 303 and 304:
- ACI - 59° Conferenza del traffic
- Page 305 and 306:
SCHEMA SINTETICO GUIDA ALLA LETTURA
- Page 307 and 308:
☺ .?. QUALITA’ DELLA RISORSA I
- Page 309 and 310:
.?. .?. QUALITA’ DELL’ARIA STAT
- Page 311 and 312:
☺ RISPOSTE ESISTENTI E’ stato e
- Page 313 and 314:
MOBILITA’ E TRAFFICO Mobilità: l
- Page 315:
URBANIZZAZIONE Densità abitativa: