ENTI LOCALI E SVILUPPO SOSTENIBILE - Centri di Ricerca
ENTI LOCALI E SVILUPPO SOSTENIBILE - Centri di Ricerca
ENTI LOCALI E SVILUPPO SOSTENIBILE - Centri di Ricerca

Create successful ePaper yourself
Turn your PDF publications into a flip-book with our unique Google optimized e-Paper software.
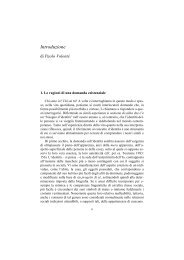
FIGURA 5.18 - Trend delle spese correnti per lo sviluppo sostenibile<br />
(euro pro-capite)<br />
520<br />
480<br />
440<br />
400<br />
360<br />
320<br />
classi <strong>di</strong> popolazione<br />
Gli interventi in campo sociale assorbono nella maggior parte dei casi risorse più<br />
elevate rispetto a quelle destinate all’aggregato ambientale, come qui definito. Dal<br />
punto <strong>di</strong> vista dell’allocazione delle risorse, la <strong>di</strong>mensione ambientale non sembra<br />
sovrastare le altre <strong>di</strong>mensioni. Ma questo non ci <strong>di</strong>ce se gli interventi siano bilanciati<br />
rispetto alle esigenze.<br />
TABELLA 5.32 - Spesa corrente dei comuni per classi <strong>di</strong> popolazione*<br />
(composizione percentuale)<br />
Classi <strong>di</strong> popolazione Spese per Spese Spese in Altre Totale<br />
l’ambiente sociali campo<br />
economico<br />
funzioni<br />
fino a 50.000 20 29 2 49 100<br />
da 50.000 a 70.000 22 20 8 50 100<br />
da 70.000 a 100.000 20 25 4 51 100<br />
da 100.000 a 200.000 20 27 3 50 100<br />
da 200.000 a 500.000 17 26 5 52 100<br />
oltre 500.000 19 22 2 57 100<br />
20 25 4 51 100<br />
* In questa tabella il settore economico comprende anche i servizi produttivi<br />
83