- Page 1 and 2:
PRESIDENZADEL CONSIGLIO DEI MINISTR
- Page 3 and 4:
DIPARTIMENTO DELLA FUNZIONE PUBBLIC
- Page 5 and 6:
IndicePresentazione di Federico Bas
- Page 7:
PresentazioneTra gli indirizzi di m
- Page 13 and 14:
1. L’oggetto dell’indagine:il c
- Page 15 and 16:
allo stesso modo nel caso in cui si
- Page 17 and 18:
II. Beni privatiDi converso, i beni
- Page 19 and 20:
Diversamente, quando un servizio è
- Page 21 and 22:
1.3. Vantaggi e svantaggi dell’es
- Page 23 and 24:
da una struttura verticale e gerarc
- Page 25 and 26:
damento della produzione di servizi
- Page 27 and 28:
Proprio dando maggiore enfasi a que
- Page 29 and 30:
tariffe dei servizi pubblici giusti
- Page 31 and 32:
1.5 Processo di esternalizzazione e
- Page 33 and 34:
quantità del fattore produttivo im
- Page 35 and 36:
Esempio 3Tipologi dei costi Ricavo
- Page 37 and 38:
gno di individuare al proprio inter
- Page 39 and 40:
zione né nel 2003 né in precedenz
- Page 41 and 42:
corso nel 2003 126 amministrazioni
- Page 43 and 44:
2.2 Dimensioni e finalizzazione del
- Page 45 and 46:
Tavola 2.1 Amministrazioni pubblich
- Page 47 and 48:
L’osservazione del comportamento
- Page 49 and 50:
Tavola 2.2a Amministrazioni pubblic
- Page 51 and 52:
Si consideri che nell’analisi dei
- Page 53 and 54:
Tavola 2.3.a Amministrazioni pubbli
- Page 55 and 56:
Anche in questo caso si può ipotiz
- Page 57 and 58:
Nel terzo paragrafo verranno analiz
- Page 59 and 60:
Figura 3.2 Amministrazioni pubblich
- Page 61 and 62:
Figura 3.4Amministrazioni pubbliche
- Page 63 and 64:
Più dinamiche, in questi ambiti, s
- Page 65 and 66:
punti percentuali) e un ricorso mag
- Page 67 and 68:
Considerando quindi sia le esternal
- Page 69 and 70:
Tra le poche (12,2%) amministrazion
- Page 71 and 72:
Con riferimento alla tipologia dell
- Page 73 and 74:
Figura 3.15Amministrazioni pubblich
- Page 75 and 76:
La tipologia di fornitore scelta da
- Page 77 and 78:
3.2.2 Esternalizzazioni di servizi
- Page 79 and 80:
Con riferimento alla tipologia dei
- Page 81 and 82:
In particolare, gli scostamenti di
- Page 83 and 84:
Figura 3.24Amministrazioni pubblich
- Page 85 and 86:
Figura 3.25Amministrazioni pubblich
- Page 87 and 88:
zione del fatto che il ruolo istitu
- Page 89 and 90:
nel Mezzogiorno, dove quote relativ
- Page 91 and 92: Le amministrazioni centrali conclud
- Page 93 and 94: Figura 3.31Amministrazioni pubblich
- Page 95 and 96: so contratti con valori ascrivibili
- Page 97 and 98: nalizzazione di servizi finali (22
- Page 99 and 100: zioni in corso nel 2003, sono pari
- Page 101 and 102: Figura 3.37Amministrazioni pubblich
- Page 103 and 104: apprestamento dei servizi (70,4%),
- Page 105 and 106: Dalla diversificazione geografica e
- Page 107 and 108: Cumulando le quote rilevate per le
- Page 109 and 110: Figura 3.43 Amministrazioni pubblic
- Page 111 and 112: 4. Brevi osservazioni conclusiveLa
- Page 113 and 114: tenze dell’unità di riferimento
- Page 115: In altre parole, sembra necessario
- Page 118 and 119: 1. Appendice statisticaTavola 1.1 A
- Page 120 and 121: Tavola 2.1 Amministrazioni pubblich
- Page 122 and 123: Tavola 3.1 Amministrazioni pubblich
- Page 124 and 125: Tavola 4.1 Amministrazioni pubblich
- Page 126 and 127: Tavola 5.1 Amministrazioni pubblich
- Page 128 and 129: Tavola 6.1 Amministrazioni pubblich
- Page 130 and 131: Tavola 7.1 Amministrazioni pubblich
- Page 132 and 133: Tavola 8.1 Amministrazioni pubblich
- Page 134 and 135: Tavola 9.1 Amministrazioni pubblich
- Page 136 and 137: Tavola 10.1 Amministrazioni pubblic
- Page 138 and 139: Tavola 11.1 Amministrazioni pubblic
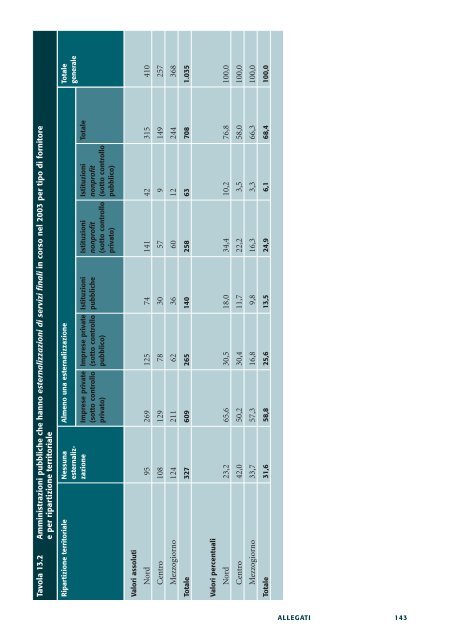
- Page 140 and 141: Tavola 12.1 Amministrazioni pubblic
- Page 144 and 145: Tavola 14.1 Amministrazioni pubblic
- Page 146 and 147: Tavola 15.1 Amministrazioni pubblic
- Page 148 and 149: Tavola 16.1 Amministrazioni pubblic
- Page 150 and 151: Tavola 17.1 Amministrazioni pubblic
- Page 152 and 153: Tavola 17.2 Amministrazioni pubblic
- Page 154 and 155: Tavola 18.1 Amministrazioni pubblic
- Page 156 and 157: Tavola 19.1 Amministrazioni pubblic
- Page 158 and 159: Tavola 20.1 Amministrazioni pubblic
- Page 160 and 161: Tavola 21.1 Amministrazioni pubblic
- Page 162 and 163: Tavola 22.1 Amministrazioni pubblic
- Page 164 and 165: Tavola 23.1 Amministrazioni pubblic
- Page 166 and 167: Tavola 24.1Amministrazioni pubblich
- Page 168 and 169: Tavola 25.1 Amministrazioni pubblic
- Page 170 and 171: Tavola 25.2 Amministrazioni pubblic
- Page 172 and 173: 2. Disegno della ricerca2.1 Dai con
- Page 174 and 175: nali che agiscono da produttori di
- Page 176 and 177: 1. Per convenzione, nelleAmministra
- Page 178 and 179: contenente in allegato il questiona
- Page 180 and 181: 2.5 Generalizzazione dei risultati
- Page 182 and 183: Tra le altre sottoclassi che regist
- Page 184 and 185: Tavola 4Amministrazioni pubbliche r
- Page 187 and 188: Rilevazione sperimentale sulla sull
- Page 189 and 190: 2.2 Indicare il numero dei contratt
- Page 191 and 192: 4.1.3 Servizi finaliTipo di attivit
- Page 193 and 194:
Quinta sezione. Conseguenze organiz
- Page 195 and 196:
12.3 Servizi finaliTipo di attivit
- Page 197 and 198:
C. Barnard, S. Deakin e C. Kilpatri
- Page 199 and 200:
P. De Vita, Flessibilità e perform
- Page 201 and 202:
E. Gualmini, L’amministrazione ne
- Page 203 and 204:
R. Mussari (curatore e coautore), M
- Page 205 and 206:
G. Selim e Yiannakas, Outsourcing t
- Page 208 and 209:
ANALISI E STRUMENTI PER L’INNOVAZ
- Page 210 and 211:
LE ESPERIENZELa valutazione e la re
- Page 212:
Progetto grafico: HaunagDesignLa co