und Standortentwicklung des wiedervernässten Grünlandes im ...
und Standortentwicklung des wiedervernässten Grünlandes im ...
und Standortentwicklung des wiedervernässten Grünlandes im ...

Sie wollen auch ein ePaper? Erhöhen Sie die Reichweite Ihrer Titel.
YUMPU macht aus Druck-PDFs automatisch weboptimierte ePaper, die Google liebt.
4. Untersuchungsergebnisse 47<br />
Kohlenstoff [g/kg]<br />
470<br />
460<br />
450<br />
440<br />
430<br />
420<br />
410<br />
N =<br />
8<br />
CBa (5+/4)<br />
8<br />
CBb (6+/5)<br />
8<br />
CZc (5+/4)<br />
8<br />
CZd (5+/+)<br />
8<br />
GBa (5+/+)<br />
8<br />
GBb (6+/5)<br />
Probeentnahmestelle<br />
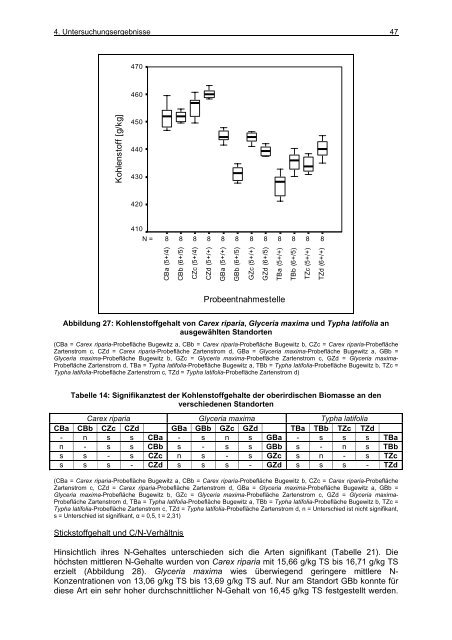
Abbildung 27: Kohlenstoffgehalt von Carex riparia, Glyceria max<strong>im</strong>a <strong>und</strong> Typha latifolia an<br />
ausgewählten Standorten<br />
(CBa = Carex riparia-Probefläche Bugewitz a, CBb = Carex riparia-Probefläche Bugewitz b, CZc = Carex riparia-Probefläche<br />
Zartenstrom c, CZd = Carex riparia-Probefläche Zartenstrom d, GBa = Glyceria max<strong>im</strong>a-Probefläche Bugewitz a, GBb =<br />
Glyceria max<strong>im</strong>a-Probefläche Bugewitz b, GZc = Glyceria max<strong>im</strong>a-Probefläche Zartenstrom c, GZd = Glyceria max<strong>im</strong>a-<br />
Probefläche Zartenstrom d, TBa = Typha latifolia-Probefläche Bugewitz a, TBb = Typha latifolia-Probefläche Bugewitz b, TZc =<br />
Typha latifolia-Probefläche Zartenstrom c, TZd = Typha latifolia-Probefläche Zartenstrom d)<br />
Tabelle 14: Signifikanztest der Kohlenstoffgehalte der oberirdischen Biomasse an den<br />
verschiedenen Standorten<br />
Carex riparia Glyceria max<strong>im</strong>a Typha latifolia<br />
CBa CBb CZc CZd GBa GBb GZc GZd TBa TBb TZc TZd<br />
- n s s CBa - s n s GBa - s s s TBa<br />
n - s s CBb s - s s GBb s - n s TBb<br />
s s - s CZc n s - s GZc s n - s TZc<br />
s s s - CZd s s s - GZd s s s - TZd<br />
(CBa = Carex riparia-Probefläche Bugewitz a, CBb = Carex riparia-Probefläche Bugewitz b, CZc = Carex riparia-Probefläche<br />
Zartenstrom c, CZd = Carex riparia-Probefläche Zartenstrom d, GBa = Glyceria max<strong>im</strong>a-Probefläche Bugewitz a, GBb =<br />
Glyceria max<strong>im</strong>a-Probefläche Bugewitz b, GZc = Glyceria max<strong>im</strong>a-Probefläche Zartenstrom c, GZd = Glyceria max<strong>im</strong>a-<br />
Probefläche Zartenstrom d, TBa = Typha latifolia-Probefläche Bugewitz a, TBb = Typha latifolia-Probefläche Bugewitz b, TZc =<br />
Typha latifolia-Probefläche Zartenstrom c, TZd = Typha latifolia-Probefläche Zartenstrom d, n = Unterschied ist nicht signifikant,<br />
s = Unterschied ist signifikant, α = 0,5, t = 2,31)<br />
Stickstoffgehalt <strong>und</strong> C/N-Verhältnis<br />
Hinsichtlich ihres N-Gehaltes unterschieden sich die Arten signifikant (Tabelle 21). Die<br />
höchsten mittleren N-Gehalte wurden von Carex riparia mit 15,66 g/kg TS bis 16,71 g/kg TS<br />
erzielt (Abbildung 28). Glyceria max<strong>im</strong>a wies überwiegend geringere mittlere N-<br />
Konzentrationen von 13,06 g/kg TS bis 13,69 g/kg TS auf. Nur am Standort GBb konnte für<br />
diese Art ein sehr hoher durchschnittlicher N-Gehalt von 16,45 g/kg TS festgestellt werden.<br />
8<br />
GZc (5+/+)<br />
8<br />
GZd (6+/5)<br />
8<br />
TBa (5+/+)<br />
8<br />
TBb (6+/5)<br />
8<br />
TZc (5+/+)<br />
8<br />
TZd (6+/+)