und Standortentwicklung des wiedervernässten Grünlandes im ...
und Standortentwicklung des wiedervernässten Grünlandes im ...
und Standortentwicklung des wiedervernässten Grünlandes im ...

Erfolgreiche ePaper selbst erstellen
Machen Sie aus Ihren PDF Publikationen ein blätterbares Flipbook mit unserer einzigartigen Google optimierten e-Paper Software.
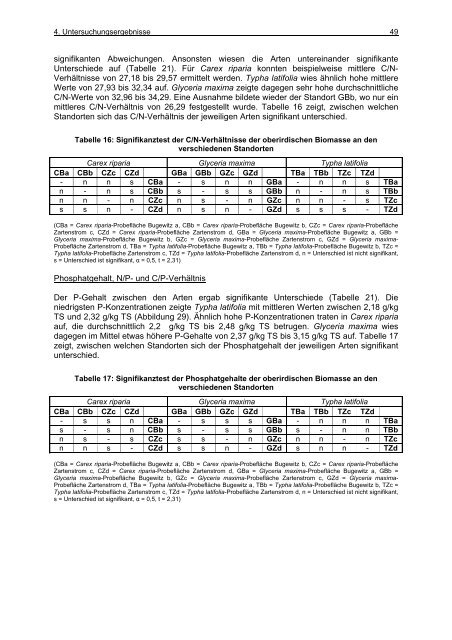
4. Untersuchungsergebnisse 49<br />
signifikanten Abweichungen. Ansonsten wiesen die Arten untereinander signifikante<br />
Unterschiede auf (Tabelle 21). Für Carex riparia konnten beispielweise mittlere C/N-<br />
Verhältnisse von 27,18 bis 29,57 ermittelt werden. Typha latifolia wies ähnlich hohe mittlere<br />
Werte von 27,93 bis 32,34 auf. Glyceria max<strong>im</strong>a zeigte dagegen sehr hohe durchschnittliche<br />
C/N-Werte von 32,96 bis 34,29. Eine Ausnahme bildete wieder der Standort GBb, wo nur ein<br />
mittleres C/N-Verhältnis von 26,29 festgestellt wurde. Tabelle 16 zeigt, zwischen welchen<br />
Standorten sich das C/N-Verhältnis der jeweiligen Arten signifikant unterschied.<br />
Tabelle 16: Signifikanztest der C/N-Verhältnisse der oberirdischen Biomasse an den<br />
verschiedenen Standorten<br />
Carex riparia Glyceria max<strong>im</strong>a Typha latifolia<br />
CBa CBb CZc CZd GBa GBb GZc GZd TBa TBb TZc TZd<br />
- n n s CBa - s n n GBa - n n s TBa<br />
n - n s CBb s - s s GBb n - n s TBb<br />
n n - n CZc n s - n GZc n n - s TZc<br />
s s n - CZd n s n - GZd s s s - TZd<br />
(CBa = Carex riparia-Probefläche Bugewitz a, CBb = Carex riparia-Probefläche Bugewitz b, CZc = Carex riparia-Probefläche<br />
Zartenstrom c, CZd = Carex riparia-Probefläche Zartenstrom d, GBa = Glyceria max<strong>im</strong>a-Probefläche Bugewitz a, GBb =<br />
Glyceria max<strong>im</strong>a-Probefläche Bugewitz b, GZc = Glyceria max<strong>im</strong>a-Probefläche Zartenstrom c, GZd = Glyceria max<strong>im</strong>a-<br />
Probefläche Zartenstrom d, TBa = Typha latifolia-Probefläche Bugewitz a, TBb = Typha latifolia-Probefläche Bugewitz b, TZc =<br />
Typha latifolia-Probefläche Zartenstrom c, TZd = Typha latifolia-Probefläche Zartenstrom d, n = Unterschied ist nicht signifikant,<br />
s = Unterschied ist signifikant, α = 0,5, t = 2,31)<br />
Phosphatgehalt, N/P- <strong>und</strong> C/P-Verhältnis<br />
Der P-Gehalt zwischen den Arten ergab signifikante Unterschiede (Tabelle 21). Die<br />
niedrigsten P-Konzentrationen zeigte Typha latifolia mit mittleren Werten zwischen 2,18 g/kg<br />
TS <strong>und</strong> 2,32 g/kg TS (Abbildung 29). Ähnlich hohe P-Konzentrationen traten in Carex riparia<br />
auf, die durchschnittlich 2,2 g/kg TS bis 2,48 g/kg TS betrugen. Glyceria max<strong>im</strong>a wies<br />
dagegen <strong>im</strong> Mittel etwas höhere P-Gehalte von 2,37 g/kg TS bis 3,15 g/kg TS auf. Tabelle 17<br />
zeigt, zwischen welchen Standorten sich der Phosphatgehalt der jeweiligen Arten signifikant<br />
unterschied.<br />
Tabelle 17: Signifikanztest der Phosphatgehalte der oberirdischen Biomasse an den<br />
verschiedenen Standorten<br />
Carex riparia Glyceria max<strong>im</strong>a Typha latifolia<br />
CBa CBb CZc CZd GBa GBb GZc GZd TBa TBb TZc TZd<br />
- s s n CBa - s s s GBa - n n n TBa<br />
s - s n CBb s - s s GBb s - n n TBb<br />
n s - s CZc s s - n GZc n n - n TZc<br />
n n s - CZd s s n - GZd s n n - TZd<br />
(CBa = Carex riparia-Probefläche Bugewitz a, CBb = Carex riparia-Probefläche Bugewitz b, CZc = Carex riparia-Probefläche<br />
Zartenstrom c, CZd = Carex riparia-Probefläche Zartenstrom d, GBa = Glyceria max<strong>im</strong>a-Probefläche Bugewitz a, GBb =<br />
Glyceria max<strong>im</strong>a-Probefläche Bugewitz b, GZc = Glyceria max<strong>im</strong>a-Probefläche Zartenstrom c, GZd = Glyceria max<strong>im</strong>a-<br />
Probefläche Zartenstrom d, TBa = Typha latifolia-Probefläche Bugewitz a, TBb = Typha latifolia-Probefläche Bugewitz b, TZc =<br />
Typha latifolia-Probefläche Zartenstrom c, TZd = Typha latifolia-Probefläche Zartenstrom d, n = Unterschied ist nicht signifikant,<br />
s = Unterschied ist signifikant, α = 0,5, t = 2,31)