- Page 1 and 2:
Journal of Medicinal Plants Researc
- Page 3 and 4:
Editors Prof. Akah Peter Achunike E
- Page 5 and 6:
Electronic submission of manuscript
- Page 7 and 8:
Fees and Charges: Authors are requi
- Page 9 and 10:
Table of Contents: Volume 6 Number
- Page 11 and 12:
Table of Contents: Volume 6 Number
- Page 13 and 14:
Table of Contents: Volume 6 Number
- Page 15 and 16:
Figure 1. Chuanxiong Rhizoma (http:
- Page 17 and 18:
Table 1. Identification of main pea
- Page 19 and 20:
Table 3. Pharmacokinetic parameters
- Page 21 and 22:
active component study, many invest
- Page 23 and 24:
Journal of Medicinal Plants Researc
- Page 25 and 26:
and 1185 kg ha -1 in the first site
- Page 27 and 28:
Table 1. Recommendation for use fer
- Page 29 and 30:
Sadanandan AK, Hamza S (1996c). Stu
- Page 31 and 32:
and it has been traced to South Ame
- Page 33 and 34:
Table 3. Results of phytochemical a
- Page 35 and 36:
Journal of Medicinal Plants Researc
- Page 37 and 38:
(a) (b) (c) Figure 1. (a) Normal ce
- Page 39 and 40:
emedies in the south of Brazil. J.
- Page 41 and 42:
known fatty acids and terpenoids we
- Page 43 and 44:
Table 1. Renal function tests of ra
- Page 45 and 46:
Al-Radahe et al. 2271 Figure 3.nnnn
- Page 47 and 48:
namely disruption of the vascular e
- Page 49 and 50:
Zayachkivska OS, Konturek SJ, Drozd
- Page 51 and 52:
β-carotene were purchased from Sig
- Page 53 and 54:
Figure 1. Effect of ethanol concent
- Page 55 and 56:
Table 3. Climatic and soil factors
- Page 57 and 58:
content of polysaccharides. Phospha
- Page 59 and 60:
Serge et al. 2285 Table 1. Relative
- Page 61 and 62:
Percentage inhibition % of inhibiti
- Page 63 and 64:
Journal of Medicinal Plants Researc
- Page 65 and 66:
Table 1. Result of phytochemical sc
- Page 67 and 68:
Table 3. Result of thin layer chrom
- Page 69 and 70:
Journal of Medicinal Plants Researc
- Page 71 and 72:
Table 2. MIC of a compound 1 from c
- Page 73 and 74:
Journal of Medicinal Plants Researc
- Page 75 and 76:
Zirihi et al. 2301 Figure 2. Termin
- Page 77 and 78:
Figure 5. T. catappa Linn. (Combret
- Page 79 and 80:
Figure 8. A. fumigatus: Aspect of c
- Page 81 and 82:
Figure 12. Sensitivity of A. fumiga
- Page 83 and 84:
Journal of Medicinal Plants Researc
- Page 85 and 86:
Noormi et al. 2311 Table 1. Callus
- Page 87 and 88:
Table 2. Contd. NoC=No callus. 4.0
- Page 89 and 90:
Figure 2. Contd. at 2.0 mg/L yellow
- Page 91 and 92:
Journal of Medicinal Plants Researc
- Page 93 and 94:
Table 1. Biochemical parameters in
- Page 95 and 96:
Figure 3. Bcl-xL reactions in inter
- Page 97 and 98:
ACKNOWLEDGMENTS The authors would l
- Page 99 and 100:
Figure 1. The first page of the boo
- Page 101 and 102: Figure 3. The most widely included
- Page 103 and 104: Figure 4. Lithographic print “St.
- Page 105 and 106: Table 1. List of plants included in
- Page 107 and 108: Table 1. Contd. Nedelcheva 2333 Cin
- Page 109 and 110: Table 1. Contd. Nedelcheva 2335 Rhe
- Page 111 and 112: 14 7 1 15 1 35 17 16 Imported plant
- Page 113 and 114: Academy of Science Publishing House
- Page 115 and 116: et al., 1996; van Wyk and Gericke,
- Page 117 and 118: DPPH inhibition (%) DPPH % inhibiti
- Page 119 and 120: % Mortality Concentration (µg/ml)
- Page 121 and 122: information on plants used for the
- Page 123 and 124: Table 1. Levels of independent vari
- Page 125 and 126: Arbutin (mg/g) Co-solvent Figure 1.
- Page 127 and 128: Arbutin (mg/g) Co-solvent Figure 3.
- Page 129 and 130: Arbutin (mg/g) Extraction pressure
- Page 131 and 132: Table 3. Arbuitn content of Asian p
- Page 133 and 134: Arbutin (mg/g) Co-solvent Figure 8.
- Page 135 and 136: Arbutin (mg/g) Extraction pressure
- Page 137 and 138: Arbutin (mg/g) Extraction temperatu
- Page 139 and 140: Journal of Medicinal Plants Researc
- Page 141 and 142: Table 1. Chemical composition of es
- Page 143 and 144: Darjazi 2369 Table 2. Statistical a
- Page 145 and 146: Table 3. Correlation matrix (number
- Page 147 and 148: Journal of Medicinal Plants Researc
- Page 149 and 150: Table 1. Precision test. extraction
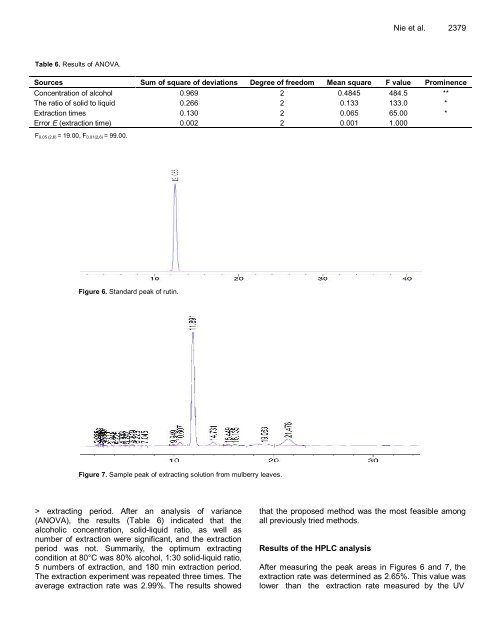
- Page 151: Figure 2. Effect of different alcoh
- Page 155 and 156: Journal of Medicinal Plants Researc
- Page 157 and 158: Table 2. Plant data and MIC values
- Page 159 and 160: exhibiting the polar extracts of P.
- Page 161 and 162: Table 3. Contd. AcOEt ++ ++ ++ - Me
- Page 163 and 164: Figure 1. Map of Ladakh region of I
- Page 165 and 166: Warghat et al. 2391 Table 3. Summar
- Page 167 and 168: Table 5. Inter-Population genetic i
- Page 169 and 170: Excoffier L, Smouse PE, Quattro JM
- Page 171 and 172: ice residue is an ideal raw materia
- Page 173 and 174: DPPH• scavenging ratio(%) OD valu
- Page 175 and 176: scavenging effect on free radical a
- Page 177 and 178: our new CL system. Fenton reaction
- Page 179 and 180: 1 2 Time (s) Figure 2. Kinetic curv
- Page 181 and 182: Wong et al., 2006). It can be seen
- Page 183 and 184: Pan YM, Liang Y, Wang HS, Liang M (
- Page 185 and 186: 2422 J. Med. Plants Res. close cano
- Page 187 and 188: 2424 J. Med. Plants Res. Table 1. M
- Page 189 and 190: 2426 J. Med. Plants Res. Table 1. C
- Page 191 and 192: 2428 J. Med. Plants Res. Table 1. C
- Page 193 and 194: 2430 J. Med. Plants Res. Table 1. C
- Page 195 and 196: 2432 J. Med. Plants Res. Table 2. D
- Page 197 and 198: 2434 J. Med. Plants Res. Table 6. T
- Page 199 and 200: 2436 J. Med. Plants Res. budget dur
- Page 201 and 202: Journal of Medicinal Plants Researc
- Page 203 and 204:
2440 J. Med. Plants Res. Table 1. R
- Page 205 and 206:
2442 J. Med. Plants Res. Stability
- Page 207 and 208:
2444 J. Med. Plants Res. production
- Page 209 and 210:
2446 J. Med. Plants Res. Figure 2.
- Page 211 and 212:
Journal of Medicinal Plants Researc
- Page 213 and 214:
2450 J. Med. Plants Res. Table 2. A
- Page 215 and 216:
2452 J. Med. Plants Res. Ghasemi Pi
- Page 217 and 218:
2454 J. Med. Plants Res. Table 1. I
- Page 219 and 220:
2456 J. Med. Plants Res. Table 3. M
- Page 221 and 222:
Journal of Medicinal Plants Researc
- Page 223 and 224:
2460 J. Med. Plants Res. Department
- Page 225 and 226:
2462 J. Med. Plants Res. Table 3. E
- Page 227 and 228:
2464 J. Med. Plants Res. Table 6. E
- Page 229 and 230:
2466 J. Med. Plants Res. AOAC (2000
- Page 231 and 232:
Journal of Medicinal Plants Researc
- Page 233 and 234:
2470 J. Med. Plants Res. Table 1. F
- Page 235 and 236:
2472 J. Med. Plants Res. Table 3. S
- Page 237 and 238:
Journal of Medicinal Plants Researc
- Page 239 and 240:
2476 J. Med. Plants Res. Figure 1.
- Page 241 and 242:
Journal of Medicinal Plants Researc
- Page 243 and 244:
2480 J. Med. Plants Res. Table 1. W
- Page 245 and 246:
2482 J. Med. Plants Res. Table 2. C
- Page 247 and 248:
2484 J. Med. Plants Res. Table 3. C
- Page 249 and 250:
2486 J. Med. Plants Res. components
- Page 251 and 252:
Journal of Medicinal Plants Researc
- Page 253 and 254:
2490 J. Med. Plants Res. Inhibition
- Page 255 and 256:
2492 J. Med. Plants Res. Figure 3.
- Page 257 and 258:
2494 J. Med. Plants Res. can increa
- Page 259 and 260:
2496 J. Med. Plants Res. Table 2. S
- Page 261 and 262:
2498 J. Med. Plants Res. Table 4. S
- Page 263 and 264:
2500 J. Med. Plants Res. Flowering
- Page 265 and 266:
2502 J. Med. Plants Res. harvest in
- Page 267 and 268:
Journal of Medicinal Plants Researc
- Page 269 and 270:
2506 J. Med. Plants Res. Figure 1.
- Page 271 and 272:
2508 J. Med. Plants Res. Table 4. S
- Page 273 and 274:
2510 J. Med. Plants Res. Figure 3.
- Page 275 and 276:
2512 J. Med. Plants Res. over-expre
- Page 277 and 278:
Journal of Medicinal Plants Researc
- Page 279 and 280:
2516 J. Med. Plants Res. Table 1. P
- Page 281 and 282:
2518 J. Med. Plants Res. Table 3. E
- Page 283 and 284:
Journal of Medicinal Plants Researc
- Page 285 and 286:
2522 J. Med. Plants Res. Figure 1.
- Page 287 and 288:
2524 J. Med. Plants Res. ACKNOWLEDG
- Page 289 and 290:
UPCOMING CONFERENCES 15th European
- Page 291:
Journal of Medicinal Plants Researc


