- Page 1 and 2: Report to: Wellgreen Project Prelim
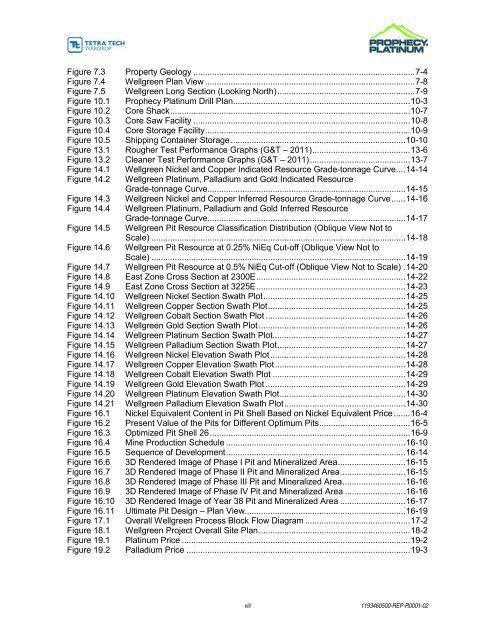
- Page 3 and 4: TABLE OF CONTENTS 1.0 SUMMARY .....
- Page 5 and 6: 14.1.8 MINERAL RESOURCE TABULATION
- Page 7 and 8: 26.1.2 PHASE 2 - QUILL CREEK ULTRAM
- Page 9: Table 19.2 Palladium Demand and Sup
- Page 13 and 14: litres per minute .................
- Page 15 and 16: International All-North Resources L
- Page 17 and 18: 1.0 S UMMARY 1.1 I NTRODUCTION Tetr
- Page 19 and 20: This PEA has been prepared by Tetra
- Page 21 and 22: Numerous operators have worked on t
- Page 23 and 24: 1.6 M INING M ETHODS The Project is
- Page 25 and 26: Figure 1.2 Wellgreen Project Overal
- Page 27 and 28: Table 1.6 Capital Cost Summary (US$
- Page 29 and 30: The following financial results wer
- Page 31 and 32: Figure 1.3 illustrates that the Pro
- Page 33 and 34: Figure 1.5 Project Execution Plan P
- Page 35 and 36: 2.0 INTRODUCTION Tetra Tech was com
- Page 37 and 38: 3.0 RELIANCE ON OTHER EXPERTS Tetra
- Page 39 and 40: Figure 4.1 Location Map Prophecy Pl
- Page 41 and 42: All work undertaken on the surface
- Page 43 and 44: Figure 4.3 Wellgreen Surface Lease
- Page 45 and 46: Other than those liabilities set fo
- Page 47 and 48: 5.3 C LIMATE The climate is alpine,
- Page 49 and 50: Year Company Activities 1970 Hudson
- Page 51 and 52: Year Company Activities 2008 Corona
- Page 53 and 54: 6.2.3 NORTHERN P LATINUM 2009 PROGR
- Page 55 and 56: Figure 7.1 Regional Geology Map Pro
- Page 57 and 58: Figure 7.3 Property Geology Prophec
- Page 59 and 60: Longitudinal faults and/or shears a
- Page 61 and 62:
Figure 7.4 Wellgreen Plan View Prop
- Page 63 and 64:
7.2.3 NORTH ZONE The North Zone is
- Page 65 and 66:
Table 7.3 PGE-Bearing Minerals in t
- Page 67 and 68:
Gabbroid-associated Nickel, Copper,
- Page 69 and 70:
10.0 DRILLING 10.1 H ISTORICAL D RI
- Page 71 and 72:
Figure 10.1 Prophecy Platinum Drill
- Page 73 and 74:
Table 10.4 Prophecy Platinum 2011 D
- Page 75 and 76:
• The course rejects returned fro
- Page 77 and 78:
Figure 10.4 Core Storage Facility P
- Page 79 and 80:
11.0 SAMPLE PREPARATION, ANALYSES,
- Page 81 and 82:
12.0 DATA VERIFICATION Tetra Tech
- Page 83 and 84:
Table 12.2 Check Assays Prophecy Pl
- Page 85 and 86:
13.0 MINERAL PROCESSING AND METALLU
- Page 87 and 88:
An elemental analysis of typical co
- Page 89 and 90:
Minerals Peridotite Composite 1 Min
- Page 91 and 92:
Ni Deposits” shows that the grade
- Page 93 and 94:
13.3 SGS V ANCOUVER - J UNE 2012 A
- Page 95 and 96:
14.0 MINERAL RESOURCE ESTIMATES 14.
- Page 97 and 98:
Table 14.3 summarizes the grade cap
- Page 99 and 100:
The NiEq value was assigned to all
- Page 101 and 102:
Table 14.7 Wellgreen Variogram Summ
- Page 103 and 104:
Table 14.9 Estimation Criteria Zone
- Page 105 and 106:
Table 14.10 Search Parameters Zone
- Page 107 and 108:
NiEq Cut-off Tonnes NiEq (%) Ni (%)
- Page 109 and 110:
Figure 14.2 Wellgreen Platinum, Pal
- Page 111 and 112:
Figure 14.4 Wellgreen Platinum, Pal
- Page 113 and 114:
Figure 14.6 Wellgreen Pit Resource
- Page 115 and 116:
14.1.9 VALIDATION The Wellgreen mod
- Page 117 and 118:
Figure 14.9 East Zone Cross Section
- Page 119 and 120:
Figure 14.10 Wellgreen Nickel Secti
- Page 121 and 122:
Figure 14.14 Wellgreen Platinum Sec
- Page 123 and 124:
Figure 14.18 Wellgreen Cobalt Eleva
- Page 125 and 126:
14.2 P REVIOUS E STIMATES Table 14.
- Page 127 and 128:
15.0 MINERAL RESERVE ESTIMATES A mi
- Page 129 and 130:
The selected base case pit contains
- Page 131 and 132:
OVERALL O PEN P IT SLOPE ANGLE Tetr
- Page 133 and 134:
Table 16.4 Pit Optimization Results
- Page 135 and 136:
The pit optimization process includ
- Page 137 and 138:
16.4 P RODUCTION S CHDULE Using Pit
- Page 139 and 140:
Year Waste (t) Total (t) Strip Rati
- Page 141 and 142:
Figure 16.5 Sequence of Development
- Page 143 and 144:
PHASE III During Phase III, the pit
- Page 145 and 146:
16.5.4 EXPLOSIVES A contractor will
- Page 147 and 148:
Table 16.9 Pit Design Criteria Item
- Page 149 and 150:
Equipment Fleet Size Units Crew Bus
- Page 151 and 152:
Figure 17.1 Overall Wellgreen Proce
- Page 153 and 154:
17.2 P ROCESS D ESIGN C RITERIA The
- Page 155 and 156:
17.5 P ROCESS P LANT The process pl
- Page 157 and 158:
Figure 18.1 Wellgreen Project Overa
- Page 159 and 160:
ultimate impoundment surface area o
- Page 161 and 162:
Table 19.2 Palladium Demand and Sup
- Page 163 and 164:
Figure 19.3 London Metals Exchange
- Page 165 and 166:
Figure 19.5 Nickel Demand (2009 to
- Page 167 and 168:
20.0 ENVIRONMENTAL STUDIES, PERMITT
- Page 169 and 170:
Tailings and mill concentrate sampl
- Page 171 and 172:
20.2.4 AQUATIC RESOURCES The Proper
- Page 173 and 174:
Figure 20.2 Wildlife Ranges-Woodlan
- Page 175 and 176:
Figure 20.4 Wildlife Ranges-Mountai
- Page 177 and 178:
Figure 20.6 Wildlife Ranges-Grizzly
- Page 179 and 180:
Figure 20.8 Aquatic Resources Proph
- Page 181 and 182:
20.3.2 LICENSING The Project will b
- Page 183 and 184:
(Transport Canada 2010). New constr
- Page 185 and 186:
Table 20.1 Applicable Legislation,
- Page 187 and 188:
20.4 M I NE C LOSURE AND R ECLAMATI
- Page 189 and 190:
Umbrella Final Agreement, the White
- Page 191 and 192:
20.5.2 NON-ABORIGINAL COMMUNITIES T
- Page 193 and 194:
21.0 C APITAL AND O PERATING C OSTS
- Page 195 and 196:
Mine Equipment 21.2.2 SUSTAINING 20
- Page 197 and 198:
Table 21.7 Contingency (US$ million
- Page 199 and 200:
• mobilization and demobilization
- Page 201 and 202:
Spares • safety including safety
- Page 203 and 204:
21.3 O PERATING C OSTS 21.3.1 GENER
- Page 205 and 206:
Table 21.11 Summary of Mining Opera
- Page 207 and 208:
Mine Operations Position No. Annual
- Page 209 and 210:
22.0 ECONOMIC A NALYSIS 22.1 I NTRO
- Page 211 and 212:
Table 22.3 Metal Production from th
- Page 213 and 214:
Table 22.4 Summary of Pre-tax Finan
- Page 215 and 216:
22.4 M ETAL P RICE S CENARIOS The L
- Page 217 and 218:
Figure 22.3 IRR Sensitivity Analysi
- Page 219 and 220:
Figure 23.1 Adjacent Properties Pro
- Page 221 and 222:
Figure 24.1 Wellgreen Project Execu
- Page 223 and 224:
25.2 M INING Table 25.1 Wellgreen R
- Page 225 and 226:
Table 25.4 Process Capital Cost Sum
- Page 227 and 228:
Table 26.1 Wellgreen Expansion Budg
- Page 229 and 230:
26.2 M INING sample selection shoul
- Page 231 and 232:
Trade-off studies should be complet
- Page 233 and 234:
• develop a negotiation strategy
- Page 235 and 236:
METALLURGY Davis, David and Bruwer,
- Page 237 and 238:
Yukon Environmental and Socio-econo
- Page 239 and 240:
TODD MCCRACKEN, P.GEO. I, Todd McCr
- Page 241 and 242:
PHILIP BRIDSON, P.ENG. I, Philip Br
- Page 243 and 244:
APPENDIX A L IST OF C LAIMS
- Page 245 and 246:
District GrantNumber RegType ClaimN
- Page 247 and 248:
District GrantNumber RegType ClaimN
- Page 249 and 250:
District GrantNumber RegType ClaimN
- Page 256 and 257:
Certificate of Analysis First issue
- Page 258 and 259:
Hf µg/g 0.5 4 / 20 Ho µg/g 0.2 3
- Page 260 and 261:
assess laboratory results, users ar
- Page 262 and 263:
Constituent Unit Mean Table 2 - Pro
- Page 264 and 265:
Table 3 - Informational Values Cons
- Page 266 and 267:
CERTIFYING OFFICER ________________
- Page 268 and 269:
An Investigation into METALLURGICAL
- Page 270 and 271:
Prophecy Platinum Corporation - Wel
- Page 272 and 273:
Prophecy Platinum Corporation - Wel
- Page 274 and 275:
Prophecy Platinum Corporation - Wel
- Page 276 and 277:
Prophecy Platinum Corporation - Wel
- Page 278 and 279:
Prophecy Platinum Corporation - Wel
- Page 280 and 281:
Sample Fraction Mass Size Distribut
- Page 282 and 283:
Mass (% Chalcopyrite) Prophecy Plat
- Page 284 and 285:
Mass (% Pentlandite) Prophecy Plati
- Page 286 and 287:
Mass (% Pyrrhotite) Prophecy Platin
- Page 288 and 289:
Prophecy Platinum Corporation - Wel
- Page 290 and 291:
Pyrrhotite Recovery % Prophecy Plat
- Page 292 and 293:
Prophecy Platinum Corporation - Wel
- Page 294 and 295:
Prophecy Platinum Corporation - Wel
- Page 296 and 297:
Prophecy Platinum Corporation - Wel
- Page 298 and 299:
Cu Rec, % Ni Rec, % Gng Rec, % 100
- Page 300 and 301:
Prophecy Platinum Corporation - Wel
- Page 302 and 303:
Prophecy Platinum Corporation - Wel
- Page 304 and 305:
Prophecy Platinum Corporation - Wel
- Page 306 and 307:
Prophecy Platinum Corporation - Wel
- Page 308 and 309:
Prophecy Platinum Corporation - Wel
- Page 310 and 311:
Grade (%) Cu + Ni Grade (g/t) PGE G
- Page 312 and 313:
Prophecy Platinum Corporation - Wel
- Page 314 and 315:
Prophecy Platinum Corporation - Wel
- Page 316 and 317:
Prophecy Platinum Corporation - Wel
- Page 318 and 319:
Prophecy Platinum Corporation - Wel
- Page 320 and 321:
Prophecy Platinum Corporation - Wel
- Page 322 and 323:
Prophecy Platinum Corporation - Wel
- Page 324 and 325:
Prophecy Platinum Corporation - Wel
- Page 326 and 327:
Prophecy Platinum Corporation - Wel
- Page 328 and 329:
Prophecy Platinum Corporation - Wel
- Page 330 and 331:
Prophecy Platinum Corporation - Wel
- Page 332 and 333:
Prophecy Platinum Corporation - Wel
- Page 334 and 335:
Prophecy Platinum Corporation - Wel
- Page 336 and 337:
Prophecy Platinum Corporation - Wel
- Page 338 and 339:
Prophecy Platinum Corporation - Wel
- Page 340 and 341:
Prophecy Platinum Corporation - Wel
- Page 342 and 343:
Prophecy, Wellgreen samples 50149-0
- Page 344 and 345:
OnLine LIMS SGS Lakefield Research
- Page 346 and 347:
OnLine LIMS SGS Lakefield Research
- Page 348 and 349:
Certificate of Analysis Work Order:
- Page 350 and 351:
Final : VC120756 Revision REVISED O
- Page 352 and 353:
Final : VC120756 Revision REVISED O
- Page 354 and 355:
Final : VC120590A Revision REVISED
- Page 356 and 357:
Final : VC120590 Revision REVISED O
- Page 358 and 359:
Final : VC120590 Revision REVISED O
- Page 360 and 361:
Final : VC120590 Revision REVISED O
- Page 362 and 363:
OnLine LIMS SGS Lakefield Research
- Page 364 and 365:
SGS Minerals Services Standard Bond
- Page 366 and 367:
Project No.: 50149-001 Test No.: MC
- Page 368 and 369:
SGS Minerals Services STANDARD BOND
- Page 370 and 371:
SGS Minerals Services Project No. D
- Page 372 and 373:
SGS Minerals Services Project No. D
- Page 374 and 375:
SGS Minerals Services Project No. D
- Page 376 and 377:
Test No.: F1 Project No.: 50149-001
- Page 378 and 379:
Test No.: F3 Project No.: 50149-001
- Page 380 and 381:
Test No.: F5 Project No.: 50149-001
- Page 382 and 383:
Test No.: F7 Project No.: 50149-001
- Page 384 and 385:
Test No.: F9 Project No.: 50149-001
- Page 386 and 387:
Test No.: F11 Project No.: 50149-00
- Page 388 and 389:
Test No.: F13 Project No.: 50149-00
- Page 390 and 391:
Test No.: F15 Project No.: 50149-00
- Page 392 and 393:
Test No.: F17 Project No.: 50149-00
- Page 394 and 395:
Test No.: Sep-F1 Project No.: 50149
- Page 396 and 397:
Test No.: F20 Project No.: 50149-00
- Page 398 and 399:
Test No.: F22 Project No.: 50149-00
- Page 400 and 401:
Test No.: F24 Project No.: 50149-00
- Page 402 and 403:
Test No.: F26 Project No.: 50149-00
- Page 404 and 405:
Test No.: F28 Project No.: 50149-00
- Page 406 and 407:
Test: F30 Project: 11603-005 50149-
- Page 408 and 409:
Test: F32 Project: 11603-005 50149-
- Page 410 and 411:
Test: F34 Project: 11603-005 50149-
- Page 412 and 413:
Test: F36 Project: 11603-005 50149-
- Page 414 and 415:
Test: F38 Project: 11603-005 50149-
- Page 416 and 417:
Test No.: F40 Project No.: 50149-00
- Page 418 and 419:
Test No.: HNI-F1 Project No.: 50149
- Page 420 and 421:
Test: HNI-F3 Project: 11603-005 501
- Page 422 and 423:
Test: HNI-F5 Project: 11603-005 501
- Page 424 and 425:
Test: LCT-1 Project: 50149-001 Date
- Page 426 and 427:
Test: LCT-1 Overall Stability Total
- Page 428 and 429:
Test: LCT-2 Metallurgical Predictio
- Page 430 and 431:
Test: LCT-3 Metallurgical Predictio
- Page 432 and 433:
Test: LCT-4 Project: 50149-001 Date
- Page 434 and 435:
Test: LCT-4 Overall Stability Total
- Page 436 and 437:
Test: LCT-5 Metallurgical Predictio
- Page 438 and 439:
Prophecy Platinum Corporation - Wel
- Page 440 and 441:
Prophecy Platinum Corp 50149-101 MI
- Page 442 and 443:
Prophecy Platinum Corp 50149-101 MI
- Page 444 and 445:
Prophecy Platinum Corp 50149-101 MI
- Page 446 and 447:
Prophecy Platinum Corp 50149-101 MI
- Page 448 and 449:
Prophecy Platinum Corp 50149-101 MI
- Page 450 and 451:
Prophecy Platinum Corp 50149-101 MI
- Page 452 and 453:
Prophecy Platinum Corp 50149-101 MI
- Page 454 and 455:
Prophecy Platinum Corp 50149-101 MI
- Page 456 and 457:
Prophecy Platinum Corp 50149-101 MI
- Page 458 and 459:
Prophecy Platinum Corp 50149-101 MI
- Page 460 and 461:
Prophecy Platinum Corp 50149-101 MI
- Page 462 and 463:
Prophecy Platinum Corp 50149-101 MI
- Page 464 and 465:
Prophecy Platinum Corp 50149-101 MI
- Page 466 and 467:
Prophecy Platinum Corp 50149-101 MI
- Page 468 and 469:
Prophecy Platinum Corp 50149-101 MI
- Page 470 and 471:
Prophecy Platinum Corp 50149-101 MI
- Page 472 and 473:
Mineral Abundance (wt.%) 100 90 80
- Page 474 and 475:
Prophecy Platinum Corp 50149-101 MI
- Page 476 and 477:
Prophecy Platinum Corp 50149-101 MI
- Page 478 and 479:
Page 10 of 23
- Page 480 and 481:
Prophecy Platinum Corp 50149-101 MI
- Page 482 and 483:
Prophecy Platinum Corp 50149-101 MI
- Page 484 and 485:
Page 16 of 23
- Page 486 and 487:
Prophecy Platinum Corp 50149-101 MI
- Page 488 and 489:
Prophecy Platinum Corp 50149-101 MI
- Page 490 and 491:
Prophecy Platinum Corp 50149-101 MI
- Page 492 and 493:
CAVM-50149-101 MI7018-MAR12 Sample
- Page 494 and 495:
CAVM-50149-101 MI7018-MAR12 Sample
- Page 496 and 497:
erra Mineralogical Services Inc. Mi
- Page 498 and 499:
TerraMS-12JUL-001 Wellgreen - Pt-Pd
- Page 500 and 501:
TerraMS-12JUL-001 Wellgreen - Pt-Pd
- Page 502 and 503:
TerraMS-12JUL-001 Wellgreen - Pt-Pd
- Page 504 and 505:
TerraMS-12JUL-001 Wellgreen - Pt-Pd
- Page 506 and 507:
TerraMS-12JUL-001 Wellgreen - Pt-Pd
- Page 508 and 509:
TerraMS-12JUL-001 Wellgreen - Pt-Pd
- Page 510 and 511:
TerraMS-12JUL-001 Wellgreen - Pt-Pd
- Page 512 and 513:
TerraMS-12JUL-001 Wellgreen - Pt-Pd
- Page 514 and 515:
APPENDIX D M INING
- Page 516 and 517:
LG Phase Revenue Factor (%) Mineral
- Page 518 and 519:
Figure 3 Overall Ultimate Pit Produ
- Page 520 and 521:
Table 3 Penetration and Drilling Ra
- Page 522 and 523:
HAULAGE General Hauling Conditions
- Page 524:
Year Mechanical Availability (%) Us


