Semiconductor Equipment - Berenberg Bank
Semiconductor Equipment - Berenberg Bank
Semiconductor Equipment - Berenberg Bank

Create successful ePaper yourself
Turn your PDF publications into a flip-book with our unique Google optimized e-Paper software.
Applied Materials Inc<br />
Technology Hardware<br />
expanding 20nm output using DP, and by the expansion of HKMG process<br />
adoption.<br />
By late 2014/2015, the semiconductor equipment market will be driven by 3D<br />
NAND- and FinFET-related spending. Recent comments from management<br />
suggest that its expected memory order intake in H2 is likely to be less than 25% of<br />
total orders, which is less positive than KLA’s and LAM’s recent results and<br />
statements.<br />
KLA is expecting memory to account for 44% of the June quarter’s total order<br />
intake, up from 28% in the March quarter and 17% in the December quarter.<br />
LAM’s memory shipment increased from a low 20% of total shipments in<br />
December 2012 to 31% in the March quarter. We therefore believe that AMAT’s<br />
memory exposure is not as great as peers KLA’s and LAM’s, hence its revenues<br />
from the 3D NAND capex boost may be limited. We estimate a much smaller<br />
revenue growth rate (3%) in 2015 following a 26% increase in 2014, due to<br />
AMAT’s memory exposure is lower, and majority of the equipment required for<br />
3D NAND capacity building would be shipping in 2014.<br />
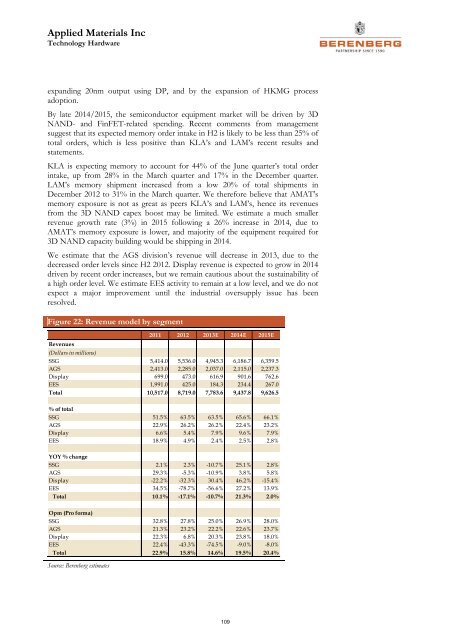
We estimate that the AGS division’s revenue will decrease in 2013, due to the<br />
decreased order levels since H2 2012. Display revenue is expected to grow in 2014<br />
driven by recent order increases, but we remain cautious about the sustainability of<br />
a high order level. We estimate EES activity to remain at a low level, and we do not<br />
expect a major improvement until the industrial oversupply issue has been<br />
resolved.<br />
Figure 22: Revenue model by segment<br />
2011 2012 2013E 2014E 2015E<br />
Revenues<br />
(Dollars in millions)<br />
SSG 5,414.0 5,536.0 4,945.3 6,186.7 6,359.5<br />
AGS 2,413.0 2,285.0 2,037.0 2,115.0 2,237.3<br />
Display 699.0 473.0 616.9 901.6 762.6<br />
EES 1,991.0 425.0 184.3 234.4 267.0<br />
Total 10,517.0 8,719.0 7,783.6 9,437.8 9,626.5<br />
% of total<br />
SSG 51.5% 63.5% 63.5% 65.6% 66.1%<br />
AGS 22.9% 26.2% 26.2% 22.4% 23.2%<br />
Display 6.6% 5.4% 7.9% 9.6% 7.9%<br />
EES 18.9% 4.9% 2.4% 2.5% 2.8%<br />
YOY % change<br />
SSG 2.1% 2.3% -10.7% 25.1% 2.8%<br />
AGS 29.3% -5.3% -10.9% 3.8% 5.8%<br />
Display -22.2% -32.3% 30.4% 46.2% -15.4%<br />
EES 34.5% -78.7% -56.6% 27.2% 13.9%<br />
Total 10.1% -17.1% -10.7% 21.3% 2.0%<br />
Opm (Pro forma)<br />
SSG 32.8% 27.8% 25.0% 26.9% 28.0%<br />
AGS 21.3% 23.2% 22.2% 22.6% 23.7%<br />
Display 22.3% 6.8% 20.3% 23.8% 18.0%<br />
EES 22.4% -43.3% -74.5% -9.0% -8.0%<br />
Total 22.9% 15.8% 14.6% 19.5% 20.4%<br />
Source: <strong>Berenberg</strong> estimates<br />
109