Semiconductor Equipment - Berenberg Bank
Semiconductor Equipment - Berenberg Bank
Semiconductor Equipment - Berenberg Bank

You also want an ePaper? Increase the reach of your titles
YUMPU automatically turns print PDFs into web optimized ePapers that Google loves.
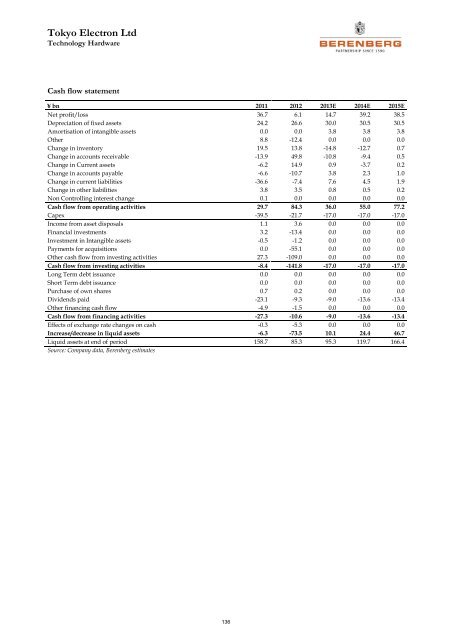
Tokyo Electron Ltd<br />
Technology Hardware<br />
Cash flow statement<br />
¥ bn 2011 2012 2013E 2014E 2015E<br />
Net profit/loss 36.7 6.1 14.7 39.2 38.5<br />
Depreciation of fixed assets 24.2 26.6 30.0 30.5 30.5<br />
Amortisation of intangible assets 0.0 0.0 3.8 3.8 3.8<br />
Other 8.8 -12.4 0.0 0.0 0.0<br />
Change in inventory 19.5 13.8 -14.8 -12.7 0.7<br />
Change in accounts receivable -13.9 49.8 -10.8 -9.4 0.5<br />
Change in Current assets -6.2 14.9 0.9 -3.7 0.2<br />
Change in accounts payable -6.6 -10.7 3.8 2.3 1.0<br />
Change in current liabilities -36.6 -7.4 7.6 4.5 1.9<br />
Change in other liabilities 3.8 3.5 0.8 0.5 0.2<br />
Non Controlling interest change 0.1 0.0 0.0 0.0 0.0<br />
Cash flow from operating activities 29.7 84.3 36.0 55.0 77.2<br />
Capex -39.5 -21.7 -17.0 -17.0 -17.0<br />
Income from asset disposals 1.1 3.6 0.0 0.0 0.0<br />
Financial investments 3.2 -13.4 0.0 0.0 0.0<br />
Investment in Intangible assets -0.5 -1.2 0.0 0.0 0.0<br />
Payments for acquisitions 0.0 -55.1 0.0 0.0 0.0<br />
Other cash flow from investing activities 27.3 -109.0 0.0 0.0 0.0<br />
Cash flow from investing activities -8.4 -141.8 -17.0 -17.0 -17.0<br />
Long Term debt issuance 0.0 0.0 0.0 0.0 0.0<br />
Short Term debt issuance 0.0 0.0 0.0 0.0 0.0<br />
Purchase of own shares 0.7 0.2 0.0 0.0 0.0<br />
Dividends paid -23.1 -9.3 -9.0 -13.6 -13.4<br />
Other financing cash flow -4.9 -1.5 0.0 0.0 0.0<br />
Cash flow from financing activities -27.3 -10.6 -9.0 -13.6 -13.4<br />
Effects of exchange rate changes on cash -0.3 -5.3 0.0 0.0 0.0<br />
Increase/decrease in liquid assets -6.3 -73.5 10.1 24.4 46.7<br />
Liquid assets at end of period 158.7 85.3 95.3 119.7 166.4<br />
Source: Company data, <strong>Berenberg</strong> estimates<br />
136