Semiconductor Equipment - Berenberg Bank
Semiconductor Equipment - Berenberg Bank
Semiconductor Equipment - Berenberg Bank

Create successful ePaper yourself
Turn your PDF publications into a flip-book with our unique Google optimized e-Paper software.
<strong>Semiconductor</strong> <strong>Equipment</strong><br />
Technology Hardware<br />
Figure 12: NAND shrinkage roadmap<br />
NAND H1 2010 H2 2010 H1 2011 H2 2011 H1 2012 H2 2012 2013E 2014E 2015E<br />
Samsung<br />
Toshiba/SanDisk<br />
Micron(Elpida)<br />
-3xnm/4xnm<br />
-3xnm/4xnm<br />
-27nm<br />
-24nm<br />
-21nm<br />
SK Hynix -3xnm/4xnm<br />
-26nm -20nm<br />
-19nm started 2012 end,<br />
- 21nm/19nm<br />
-16nm start in H2<br />
-25nm -20nm started in 2012 H1,<br />
-50% capacity on<br />
-19nm started in 2012 end,<br />
-19nm as main capacity<br />
-1Y(18nm-15nm) start in 2013<br />
-16nm start in 2013 end<br />
-16nm expansion<br />
-21/19/16nm<br />
-Start 3D NAND<br />
-16nm expansion<br />
-16nm start in 2013 end,<br />
-20nm/16nm<br />
-mainly ship 20nm,<br />
- start 16nm in Q3<br />
-1znm (12-14nm),<br />
-1Y nm/1xnm<br />
-3D NAND.<br />
Source: Gartner data, <strong>Berenberg</strong> estimates<br />
Most vendors are currently building NAND at 19nm/20nm node, and are planning<br />
to start 16nm node at the end of the year (see Figure 12 above). We believe 16nm<br />
will mature in 2014, and vendors will enter 1Znm (12nm-14nm) and 3D NAND in<br />
2014/2015.<br />
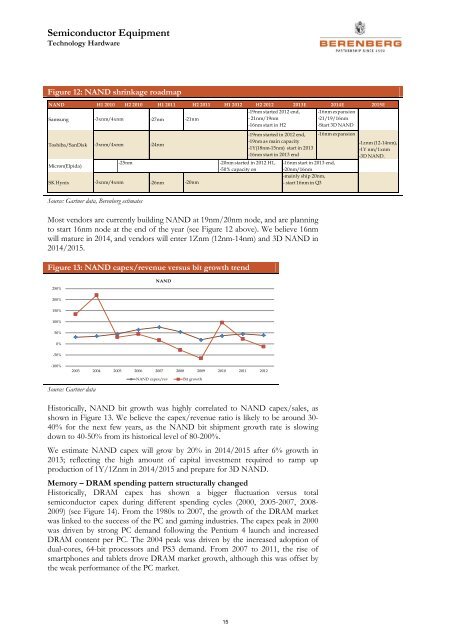
Figure 13: NAND capex/revenue versus bit growth trend<br />
250%<br />
NAND<br />
200%<br />
150%<br />
100%<br />
50%<br />
0%<br />
-50%<br />
-100%<br />
2003 2004 2005 2006 2007 2008 2009 2010 2011 2012<br />
Source: Gartner data<br />
NAND capex/rev<br />
Bit growth<br />
Historically, NAND bit growth was highly correlated to NAND capex/sales, as<br />
shown in Figure 13. We believe the capex/revenue ratio is likely to be around 30-<br />
40% for the next few years, as the NAND bit shipment growth rate is slowing<br />
down to 40-50% from its historical level of 80-200%.<br />
We estimate NAND capex will grow by 20% in 2014/2015 after 6% growth in<br />
2013; reflecting the high amount of capital investment required to ramp up<br />
production of 1Y/1Znm in 2014/2015 and prepare for 3D NAND.<br />
Memory – DRAM spending pattern structurally changed<br />
Historically, DRAM capex has shown a bigger fluctuation versus total<br />
semiconductor capex during different spending cycles (2000, 2005-2007, 2008-<br />
2009) (see Figure 14). From the 1980s to 2007, the growth of the DRAM market<br />
was linked to the success of the PC and gaming industries. The capex peak in 2000<br />
was driven by strong PC demand following the Pentium 4 launch and increased<br />
DRAM content per PC. The 2004 peak was driven by the increased adoption of<br />
dual-cores, 64-bit processors and PS3 demand. From 2007 to 2011, the rise of<br />
smartphones and tablets drove DRAM market growth, although this was offset by<br />
the weak performance of the PC market.<br />
15