Semiconductor Equipment - Berenberg Bank
Semiconductor Equipment - Berenberg Bank
Semiconductor Equipment - Berenberg Bank

You also want an ePaper? Increase the reach of your titles
YUMPU automatically turns print PDFs into web optimized ePapers that Google loves.
Applied Materials Inc<br />
Technology Hardware<br />
Margin to expand with revenue growth and cost saving<br />
The SSG operating margin is expected to be down in 2013, with the cost saving<br />
expected from its planned factory shutdown offset by the low margin achieved in<br />
the first two quarters. However, we believe that the SSG margin will improve over<br />
the next two years driven by an increase in the top line and further cost-saving<br />
initiatives. We expect that the AGS operating margin will move with the top line,<br />
and hence also expand in 2014 and 2015. The Display division’s operating margin<br />
is projected to be 24% in 2014, due to the higher revenue level expected in this<br />
segment. We expect display’s revenue to drop by 24% in 2015 after 54% growth in<br />
2014, as we do not believe the strong order momentum will last. We believe that<br />
the loss in EES will narrow over time from $184m in 2012 to $137m in 2013,<br />
driven by the ongoing cost-saving programme.<br />
We estimate the gross margin will expand as revenues increase, from 40.9% in<br />
2012 to 42.1% in 2013 and 43.6% in 2014.<br />
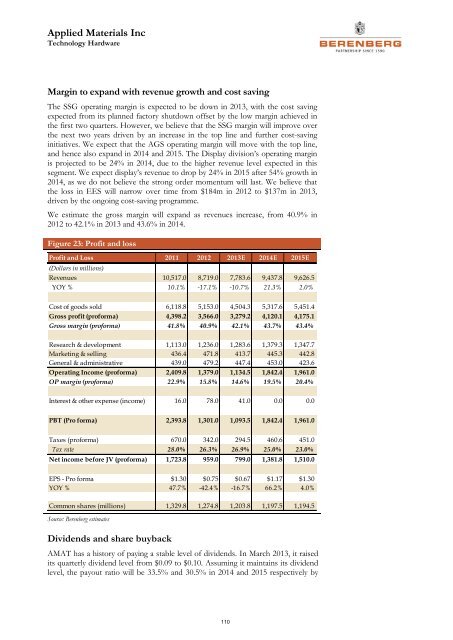
Figure 23: Profit and loss<br />
Profit and Loss 2011 2012 2013E 2014E 2015E<br />
(Dollars in millions)<br />
Revenues 10,517.0 8,719.0 7,783.6 9,437.8 9,626.5<br />
YOY % 10.1% -17.1% -10.7% 21.3% 2.0%<br />
Cost of goods sold 6,118.8 5,153.0 4,504.3 5,317.6 5,451.4<br />
Gross profit (proforma) 4,398.2 3,566.0 3,279.2 4,120.1 4,175.1<br />
Gross margin (proforma) 41.8% 40.9% 42.1% 43.7% 43.4%<br />
Research & development 1,113.0 1,236.0 1,283.6 1,379.3 1,347.7<br />
Marketing & selling 436.4 471.8 413.7 445.3 442.8<br />
General & administrative 439.0 479.2 447.4 453.0 423.6<br />
Operating Income (proforma) 2,409.8 1,379.0 1,134.5 1,842.4 1,961.0<br />
OP margin (proforma) 22.9% 15.8% 14.6% 19.5% 20.4%<br />
Interest & other expense (income) 16.0 78.0 41.0 0.0 0.0<br />
PBT (Pro forma) 2,393.8 1,301.0 1,093.5 1,842.4 1,961.0<br />
Taxes (proforma) 670.0 342.0 294.5 460.6 451.0<br />
Tax rate 28.0% 26.3% 26.9% 25.0% 23.0%<br />
Net income before JV (proforma) 1,723.8 959.0 799.0 1,381.8 1,510.0<br />
EPS - Pro forma $1.30 $0.75 $0.67 $1.17 $1.30<br />
YOY % 47.7% -42.4% -16.7% 66.2% 4.0%<br />
Common shares (millions) 1,329.8 1,274.8 1,203.8 1,197.5 1,194.5<br />
Source: <strong>Berenberg</strong> estimates<br />
Dividends and share buyback<br />
AMAT has a history of paying a stable level of dividends. In March 2013, it raised<br />
its quarterly dividend level from $0.09 to $0.10. Assuming it maintains its dividend<br />
level, the payout ratio will be 33.5% and 30.5% in 2014 and 2015 respectively by<br />
110