Semiconductor Equipment - Berenberg Bank
Semiconductor Equipment - Berenberg Bank
Semiconductor Equipment - Berenberg Bank

You also want an ePaper? Increase the reach of your titles
YUMPU automatically turns print PDFs into web optimized ePapers that Google loves.
<strong>Semiconductor</strong> <strong>Equipment</strong><br />
Technology Hardware<br />
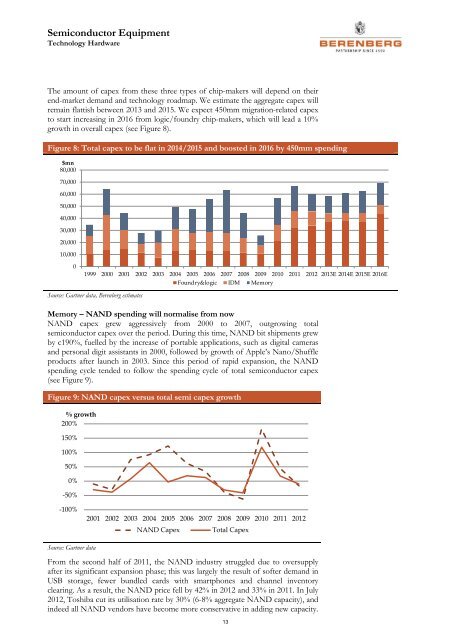
The amount of capex from these three types of chip-makers will depend on their<br />
end-market demand and technology roadmap. We estimate the aggregate capex will<br />
remain flattish between 2013 and 2015. We expect 450mm migration-related capex<br />
to start increasing in 2016 from logic/foundry chip-makers, which will lead a 10%<br />
growth in overall capex (see Figure 8).<br />
Figure 8: Total capex to be flat in 2014/2015 and boosted in 2016 by 450mm spending<br />
$mn<br />
80,000<br />
70,000<br />
60,000<br />
50,000<br />
40,000<br />
30,000<br />
20,000<br />
10,000<br />
0<br />
Source: Gartner data, <strong>Berenberg</strong> estimates<br />
Memory – NAND spending will normalise from now<br />
NAND capex grew aggressively from 2000 to 2007, outgrowing total<br />
semiconductor capex over the period. During this time, NAND bit shipments grew<br />
by c190%, fuelled by the increase of portable applications, such as digital cameras<br />
and personal digit assistants in 2000, followed by growth of Apple’s Nano/Shuffle<br />
products after launch in 2003. Since this period of rapid expansion, the NAND<br />
spending cycle tended to follow the spending cycle of total semiconductor capex<br />
(see Figure 9).<br />
Figure 9: NAND capex versus total semi capex growth<br />
% growth<br />
200%<br />
150%<br />
100%<br />
50%<br />
0%<br />
-50%<br />
1999 2000 2001 2002 2003 2004 2005 2006 2007 2008 2009 2010 2011 2012 2013E 2014E 2015E 2016E<br />
Foundry&logic IDM Memory<br />
-100%<br />
2001 2002 2003 2004 2005 2006 2007 2008 2009 2010 2011 2012<br />
NAND Capex<br />
Total Capex<br />
Source: Gartner data<br />
From the second half of 2011, the NAND industry struggled due to oversupply<br />
after its significant expansion phase; this was largely the result of softer demand in<br />
USB storage, fewer bundled cards with smartphones and channel inventory<br />
clearing. As a result, the NAND price fell by 42% in 2012 and 33% in 2011. In July<br />
2012, Toshiba cut its utilisation rate by 30% (6-8% aggregate NAND capacity), and<br />
indeed all NAND vendors have become more conservative in adding new capacity.<br />
13