Semiconductor Equipment - Berenberg Bank
Semiconductor Equipment - Berenberg Bank
Semiconductor Equipment - Berenberg Bank

You also want an ePaper? Increase the reach of your titles
YUMPU automatically turns print PDFs into web optimized ePapers that Google loves.
Applied Materials Inc<br />
Technology Hardware<br />
Recovery and growth already priced in<br />
In our bull-case scenario, we believe AMAT’s SSG revenue will grow at c6.2%<br />
from now to 2016, and exceed the 2007 revenue peak by 2016, driven by 1) the<br />
strong WFE spending environment (WFE spending is likely to grow from $30bn<br />
today to $37bn in 2016 and $40bn in 2017), and 2) a 1% WFE share gain mainly<br />
due to a 5% process control potential share gain. Our bull cash 2016 non-GAAP<br />
EPS will reach $1.7, which has a CAGR of 23% pa from 2012 to 2016, driven by<br />
an opex cut from 25% of revenue in 2012 to 20% by 2016. However, the $1.7<br />
bull-case EPS is 20% lower than AMAT’s bull-case scenario $2.15.<br />
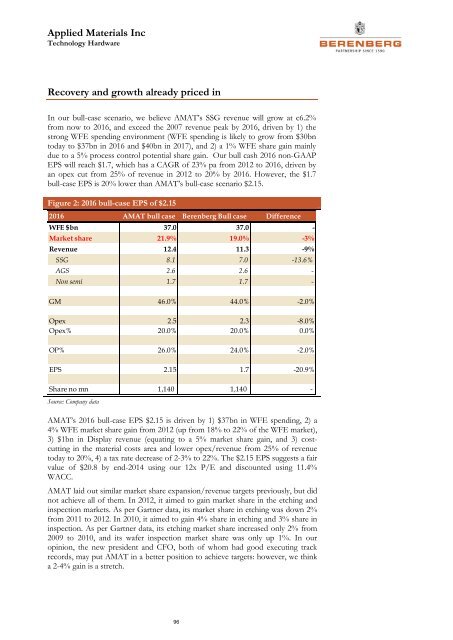
Figure 2: 2016 bull-case EPS of $2.15<br />
2016 AMAT bull case <strong>Berenberg</strong> Bull case Difference<br />
WFE $bn 37.0 37.0 -<br />
Market share 21.9% 19.0% -3%<br />
Revenue 12.4 11.3 -9%<br />
SSG 8.1 7.0 -13.6%<br />
AGS 2.6 2.6 -<br />
Non semi 1.7 1.7 -<br />
GM 46.0% 44.0% -2.0%<br />
Opex 2.5 2.3 -8.0%<br />
Opex% 20.0% 20.0% 0.0%<br />
OP% 26.0% 24.0% -2.0%<br />
EPS 2.15 1.7 -20.9%<br />
Share no mn 1,140 1,140 -<br />
Source: Company data<br />
AMAT’s 2016 bull-case EPS $2.15 is driven by 1) $37bn in WFE spending, 2) a<br />
4% WFE market share gain from 2012 (up from 18% to 22% of the WFE market),<br />
3) $1bn in Display revenue (equating to a 5% market share gain, and 3) costcutting<br />
in the material costs area and lower opex/revenue from 25% of revenue<br />
today to 20%, 4) a tax rate decrease of 2-3% to 22%. The $2.15 EPS suggests a fair<br />
value of $20.8 by end-2014 using our 12x P/E and discounted using 11.4%<br />
WACC.<br />
AMAT laid out similar market share expansion/revenue targets previously, but did<br />
not achieve all of them. In 2012, it aimed to gain market share in the etching and<br />
inspection markets. As per Gartner data, its market share in etching was down 2%<br />
from 2011 to 2012. In 2010, it aimed to gain 4% share in etching and 3% share in<br />
inspection. As per Gartner data, its etching market share increased only 2% from<br />
2009 to 2010, and its wafer inspection market share was only up 1%. In our<br />
opinion, the new president and CFO, both of whom had good executing track<br />
records, may put AMAT in a better position to achieve targets: however, we think<br />
a 2-4% gain is a stretch.<br />
96