Semiconductor Equipment - Berenberg Bank
Semiconductor Equipment - Berenberg Bank
Semiconductor Equipment - Berenberg Bank

You also want an ePaper? Increase the reach of your titles
YUMPU automatically turns print PDFs into web optimized ePapers that Google loves.
ASML Holding NV<br />
Technology Hardware<br />
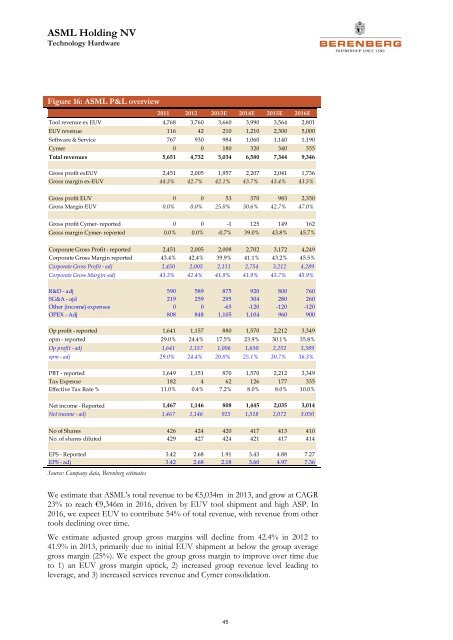
Figure 16: ASML P&L overview<br />
2011 2012 2013E 2014E 2015E 2016E<br />
Tool revenue ex EUV 4,768 3,760 3,660 3,990 3,564 2,801<br />
EUV revenue 116 42 210 1,210 2,300 5,000<br />
Software & Service 767 930 984 1,060 1,140 1,190<br />
Cymer 0 0 180 320 340 355<br />
Total revenues 5,651 4,732 5,034 6,580 7,344 9,346<br />
Gross profit exEUV 2,451 2,005 1,957 2,207 2,041 1,736<br />
Gross margin ex-EUV 44.3% 42.7% 42.1% 43.7% 43.4% 43.5%<br />
Gross profit EUV 0 0 53 370 983 2,350<br />
Gross Margin EUV 0.0% 0.0% 25.0% 30.6% 42.7% 47.0%<br />
Gross profit Cymer- reported 0 0 -1 125 149 162<br />
Gross margin Cymer- reported 0.0% 0.0% -0.7% 39.0% 43.8% 45.7%<br />
Corporate Gross Profit - reported 2,451 2,005 2,008 2,702 3,172 4,249<br />
Corporate Gross Margin reported 43.4% 42.4% 39.9% 41.1% 43.2% 45.5%<br />
Corporate Gross Profit - adj 2,450 2,005 2,111 2,754 3,212 4,289<br />
Corporate Gross Margin -adj 43.3% 42.4% 41.9% 41.9% 43.7% 45.9%<br />
R&D - adj 590 589 875 920 800 760<br />
SG&A - ajd 219 259 295 304 280 260<br />
Other (income) expenses 0 0 -65 -120 -120 -120<br />
OPEX - Adj 808 848 1,105 1,104 960 900<br />
Op profit - reported 1,641 1,157 880 1,570 2,212 3,349<br />
opm - reported 29.0% 24.4% 17.5% 23.9% 30.1% 35.8%<br />
Op profit - adj 1,641 1,157 1,006 1,650 2,252 3,389<br />
opm - adj 29.0% 24.4% 20.0% 25.1% 30.7% 36.3%<br />
PBT - reported 1,649 1,151 870 1,570 2,212 3,349<br />
Tax Expense 182 4 62 126 177 335<br />
Effective Tax Rate % 11.0% 0.4% 7.2% 8.0% 8.0% 10.0%<br />
Net income - Reported 1,467 1,146 808 1,445 2,035 3,014<br />
Net income - adj 1,467 1,146 925 1,518 2,072 3,050<br />
No of Shares 426 424 420 417 413 410<br />
No. of shares diluted 429 427 424 421 417 414<br />
EPS - Reported 3.42 2.68 1.91 3.43 4.88 7.27<br />
EPS - adj 3.42 2.68 2.18 3.60 4.97 7.36<br />
Source: Company data, <strong>Berenberg</strong> estimates<br />
We estimate that ASML’s total revenue to be €5,034m in 2013, and grow at CAGR<br />
23% to reach €9,346m in 2016, driven by EUV tool shipment and high ASP. In<br />
2016, we expect EUV to contribute 54% of total revenue, with revenue from other<br />
tools declining over time.<br />
We estimate adjusted group gross margins will decline from 42.4% in 2012 to<br />
41.9% in 2013, primarily due to initial EUV shipment at below the group average<br />
gross margin (25%). We expect the group gross margin to improve over time due<br />
to 1) an EUV gross margin uptick, 2) increased group revenue level leading to<br />
leverage, and 3) increased services revenue and Cymer consolidation.<br />
45