Semiconductor Equipment - Berenberg Bank
Semiconductor Equipment - Berenberg Bank
Semiconductor Equipment - Berenberg Bank

Create successful ePaper yourself
Turn your PDF publications into a flip-book with our unique Google optimized e-Paper software.
<strong>Semiconductor</strong> <strong>Equipment</strong><br />
Technology Hardware<br />
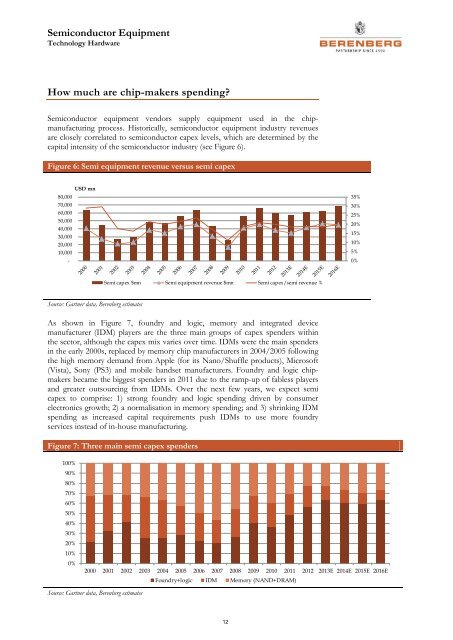
How much are chip-makers spending?<br />
<strong>Semiconductor</strong> equipment vendors supply equipment used in the chipmanufacturing<br />
process. Historically, semiconductor equipment industry revenues<br />
are closely correlated to semiconductor capex levels, which are determined by the<br />
capital intensity of the semiconductor industry (see Figure 6).<br />
Figure 6: Semi equipment revenue versus semi capex<br />
USD mn<br />
80,000<br />
70,000<br />
60,000<br />
50,000<br />
40,000<br />
30,000<br />
20,000<br />
10,000<br />
-<br />
35%<br />
30%<br />
25%<br />
20%<br />
15%<br />
10%<br />
5%<br />
0%<br />
Semi capex $mn Semi equipment revenue $mn Semi capex/semi revenue %<br />
Source: Gartner data, <strong>Berenberg</strong> estimates<br />
As shown in Figure 7, foundry and logic, memory and integrated device<br />
manufacturer (IDM) players are the three main groups of capex spenders within<br />
the sector, although the capex mix varies over time. IDMs were the main spenders<br />
in the early 2000s, replaced by memory chip manufacturers in 2004/2005 following<br />
the high memory demand from Apple (for its Nano/Shuffle products), Microsoft<br />
(Vista), Sony (PS3) and mobile handset manufacturers. Foundry and logic chipmakers<br />
became the biggest spenders in 2011 due to the ramp-up of fabless players<br />
and greater outsourcing from IDMs. Over the next few years, we expect semi<br />
capex to comprise: 1) strong foundry and logic spending driven by consumer<br />
electronics growth; 2) a normalisation in memory spending; and 3) shrinking IDM<br />
spending as increased capital requirements push IDMs to use more foundry<br />
services instead of in-house manufacturing.<br />
Figure 7: Three main semi capex spenders<br />
100%<br />
90%<br />
80%<br />
70%<br />
60%<br />
50%<br />
40%<br />
30%<br />
20%<br />
10%<br />
0%<br />
2000 2001 2002 2003 2004 2005 2006 2007 2008 2009 2010 2011 2012 2013E 2014E 2015E 2016E<br />
Foundry+logic IDM Memory (NAND+DRAM)<br />
Source: Gartner data, <strong>Berenberg</strong> estimates<br />
12