Semiconductor Equipment - Berenberg Bank
Semiconductor Equipment - Berenberg Bank
Semiconductor Equipment - Berenberg Bank

You also want an ePaper? Increase the reach of your titles
YUMPU automatically turns print PDFs into web optimized ePapers that Google loves.
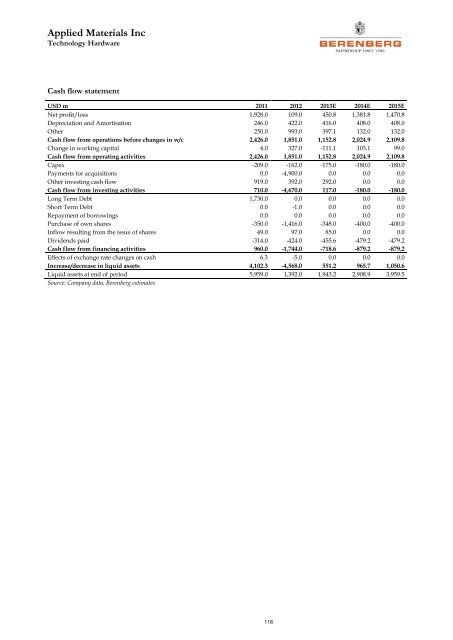
Applied Materials Inc<br />
Technology Hardware<br />
Cash flow statement<br />
USD m 2011 2012 2013E 2014E 2015E<br />
Net profit/loss 1,928.0 109.0 450.8 1,381.8 1,470.8<br />
Depreciation and Amortisation 246.0 422.0 416.0 408.0 408.0<br />
Other 250.0 993.0 397.1 132.0 132.0<br />
Cash flow from operations before changes in w/c 2,426.0 1,851.0 1,152.8 2,024.9 2,109.8<br />
Change in working capital 4.0 327.0 -111.1 103.1 99.0<br />
Cash flow from operating activities 2,426.0 1,851.0 1,152.8 2,024.9 2,109.8<br />
Capex -209.0 -162.0 -175.0 -180.0 -180.0<br />
Payments for acquisitions 0.0 -4,900.0 0.0 0.0 0.0<br />
Other investing cash flow 919.0 392.0 292.0 0.0 0.0<br />
Cash flow from investing activities 710.0 -4,670.0 117.0 -180.0 -180.0<br />
Long Term Debt 1,730.0 0.0 0.0 0.0 0.0<br />
Short Term Debt 0.0 -1.0 0.0 0.0 0.0<br />
Repayment of borrowings 0.0 0.0 0.0 0.0 0.0<br />
Purchase of own shares -350.0 -1,416.0 -348.0 -400.0 -400.0<br />
Inflow resulting from the issue of shares 49.0 97.0 85.0 0.0 0.0<br />
Dividends paid -314.0 -424.0 -455.6 -479.2 -479.2<br />
Cash flow from financing activities 960.0 -1,744.0 -718.6 -879.2 -879.2<br />
Effects of exchange rate changes on cash 6.3 -5.0 0.0 0.0 0.0<br />
Increase/decrease in liquid assets 4,102.3 -4,568.0 551.2 965.7 1,050.6<br />
Liquid assets at end of period 5,959.0 1,392.0 1,943.2 2,908.9 3,959.5<br />
Source: Company data, <strong>Berenberg</strong> estimates<br />
116