Semiconductor Equipment - Berenberg Bank
Semiconductor Equipment - Berenberg Bank
Semiconductor Equipment - Berenberg Bank

Create successful ePaper yourself
Turn your PDF publications into a flip-book with our unique Google optimized e-Paper software.
ASM International NV<br />
Small/Mid-Cap: Technology Hardware<br />
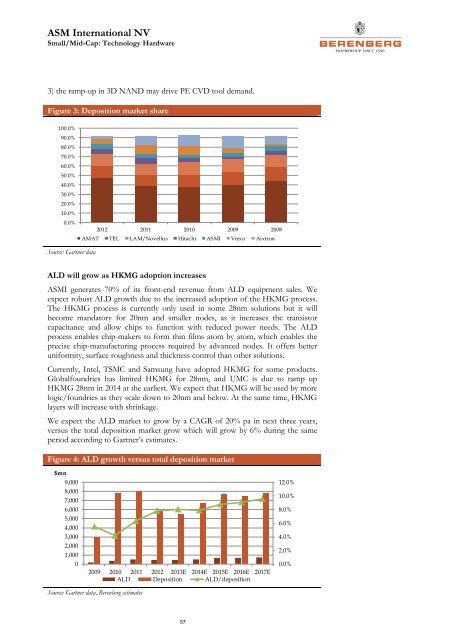
3) the ramp-up in 3D NAND may drive PE CVD tool demand.<br />
Figure 3: Deposition market share<br />
100.0%<br />
90.0%<br />
80.0%<br />
70.0%<br />
60.0%<br />
50.0%<br />
40.0%<br />
30.0%<br />
20.0%<br />
10.0%<br />
0.0%<br />
2012 2011 2010 2009 2008<br />
AMAT TEL LAM/Novellus Hitachi ASMI Veeco Aixtron<br />
Source: Gartner data<br />
ALD will grow as HKMG adoption increases<br />
ASMI generates 70% of its front-end revenue from ALD equipment sales. We<br />
expect robust ALD growth due to the increased adoption of the HKMG process.<br />
The HKMG process is currently only used in some 28nm solutions but it will<br />
become mandatory for 20nm and smaller nodes, as it increases the transistor<br />
capacitance and allow chips to function with reduced power needs. The ALD<br />
process enables chip-makers to form thin films atom by atom, which enables the<br />
precise chip-manufacturing process required by advanced nodes. It offers better<br />
uniformity, surface roughness and thickness control than other solutions.<br />
Currently, Intel, TSMC and Samsung have adopted HKMG for some products.<br />
Globalfoundries has limited HKMG for 28nm, and UMC is due to ramp up<br />
HKMG 28nm in 2014 at the earliest. We expect that HKMG will be used by more<br />
logic/foundries as they scale down to 20nm and below. At the same time, HKMG<br />
layers will increase with shrinkage.<br />
We expect the ALD market to grow by a CAGR of 20% pa in next three years,<br />
versus the total deposition market grow which will grow by 6% during the same<br />
period according to Gartner’s estimates.<br />
Figure 4: ALD growth versus total deposition market<br />
$mn<br />
9,000<br />
8,000<br />
7,000<br />
6,000<br />
5,000<br />
4,000<br />
3,000<br />
2,000<br />
1,000<br />
0<br />
2009 2010 2011 2012 2013E 2014E 2015E 2016E 2017E<br />
ALD Deposition ALD/deposition<br />
12.0%<br />
10.0%<br />
8.0%<br />
6.0%<br />
4.0%<br />
2.0%<br />
0.0%<br />
Source: Gartner data, <strong>Berenberg</strong> estimates<br />
57