Semiconductor Equipment - Berenberg Bank
Semiconductor Equipment - Berenberg Bank
Semiconductor Equipment - Berenberg Bank

Create successful ePaper yourself
Turn your PDF publications into a flip-book with our unique Google optimized e-Paper software.
Tokyo Electron Ltd<br />
Technology Hardware<br />
Investment summary<br />
Our investment thesis on Sell-rated TEL is predicated on the following five points.<br />
• TEL is mainly exposed to legacy markets: TEL generates 77% of its SPE<br />
revenue from low-growth/declining markets. Compared to its peers ASML,<br />
ASMI, AMAT, KLA and LAM, which respectively have 0%, 9%, 39%, 0% and<br />
26% of their revenue exposed to low-growth/declining markets, TEL’s growth<br />
opportunity from expansion in its current markets is the weakest of the six<br />
companies. Therefore, we do not believe TEL will benefit from new chip<br />
designs/semiconductor technology as much as its peers.<br />
• TEL unlikely to return to 2007 peak: At the Semicon 2013 event in the US in<br />
July, TEL shared its bull-case scenario. It expects its FY 2017 revenues (ie to<br />
end-March 2018) to return to the FY 2007 peak level of ¥906bn from ¥497bn<br />
in 2012, driven by market expansion and share gains in etching and cleaning<br />
processes. We do not believe that TEL will be able to return to its 2007 peak<br />
level for the following reasons.<br />
o Revenue failed to return to the 2007 peak level during the last peak cycle<br />
(2009-2011). TEL’s revenue reached ¥668bn during this period, which was<br />
26% lower than the 2007 peak. The operating margin was 15% at the peak,<br />
compared with 19% in 2007. We believe that this lower revenue and margin<br />
was due to the impact of its exposure to low-growth markets.<br />
o TEL’s SPE revenue as a percentage of total wafer fab equipment (WFE)<br />
spending decreased from 20% in 2007 to 13% in 2012 excluding the impact<br />
of FX movements. We estimate TEL’s share of WFE decrease to 12% in<br />
2015 and 11% in 2017, as it is less likely to benefit from the new chip<br />
designs compare with its peers.<br />
o Our FY 2017 revenue estimate for TEL is ¥662bn (27% lower than TEL’s<br />
bull-case scenario of ¥906bn), including SPE revenue of ¥450bn (applying<br />
an 11% share of total WFE spending to TEL’s 2017 WFE estimate of<br />
$40bn), FPD/PV revenue of ¥101bn (in line with the 2007 peak level, plus<br />
¥32bn in solar revenue), and components revenue of ¥111bn (in line with<br />
the 2007 peak). Our operating margin in FY 2017 is 15% (TEL’s estimate:<br />
19%), including a ¥30bn cost saving compared with the 2012 level of<br />
¥146bn.<br />
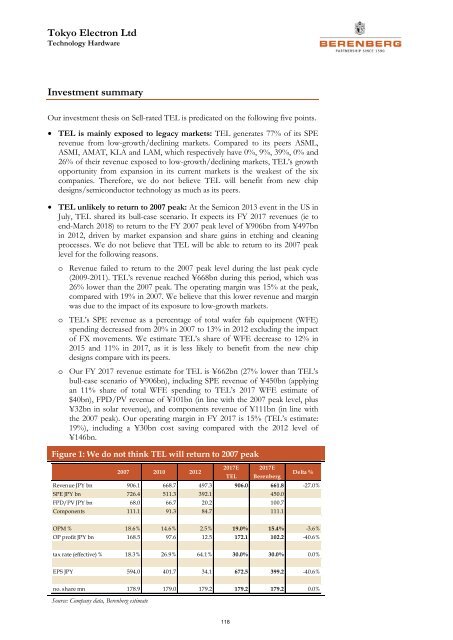
Figure 1: We do not think TEL will return to 2007 peak<br />
2007 2010 2012<br />
2017E 2017E<br />
TEL <strong>Berenberg</strong><br />
Delta %<br />
Revenue JPY bn 906.1 668.7 497.3 906.0 661.8 -27.0%<br />
SPE JPY bn 726.4 511.3 392.1 450.0<br />
FPD/PV JPY bn 68.0 66.7 20.2 100.7<br />
Components 111.1 91.3 84.7 111.1<br />
OPM % 18.6% 14.6% 2.5% 19.0% 15.4% -3.6%<br />
OP profit JPY bn 168.5 97.6 12.5 172.1 102.2 -40.6%<br />
tax rate (effective) % 18.3% 26.9% 64.1% 30.0% 30.0% 0.0%<br />
EPS JPY 594.0 401.7 34.1 672.5 399.2 -40.6%<br />
no. share mn 178.9 179.0 179.2 179.2 179.2 0.0%<br />
Source: Company data, <strong>Berenberg</strong> estimate<br />
118