Semiconductor Equipment - Berenberg Bank
Semiconductor Equipment - Berenberg Bank
Semiconductor Equipment - Berenberg Bank

Create successful ePaper yourself
Turn your PDF publications into a flip-book with our unique Google optimized e-Paper software.
<strong>Semiconductor</strong> <strong>Equipment</strong><br />
Technology Hardware<br />
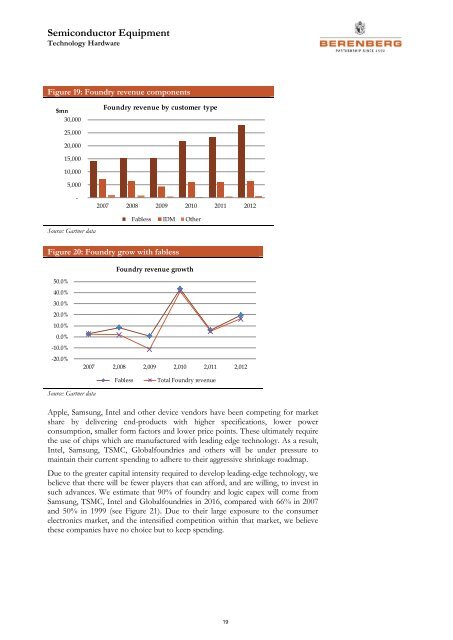
Figure 19: Foundry revenue components<br />
$mn<br />
30,000<br />
Foundry revenue by customer type<br />
25,000<br />
20,000<br />
15,000<br />
10,000<br />
5,000<br />
-<br />
2007 2008 2009 2010 2011 2012<br />
Fabless IDM Other<br />
Source: Gartner data<br />
Figure 20: Foundry grow with fabless<br />
Foundry revenue growth<br />
50.0%<br />
40.0%<br />
30.0%<br />
20.0%<br />
10.0%<br />
0.0%<br />
-10.0%<br />
-20.0%<br />
2007 2,008 2,009 2,010 2,011 2,012<br />
Fabless<br />
Total Foundry revenue<br />
Source: Gartner data<br />
Apple, Samsung, Intel and other device vendors have been competing for market<br />
share by delivering end-products with higher specifications, lower power<br />
consumption, smaller form factors and lower price points. These ultimately require<br />
the use of chips which are manufactured with leading edge technology. As a result,<br />
Intel, Samsung, TSMC, Globalfoundries and others will be under pressure to<br />
maintain their current spending to adhere to their aggressive shrinkage roadmap.<br />
Due to the greater capital intensity required to develop leading-edge technology, we<br />
believe that there will be fewer players that can afford, and are willing, to invest in<br />
such advances. We estimate that 90% of foundry and logic capex will come from<br />
Samsung, TSMC, Intel and Globalfoundries in 2016, compared with 66% in 2007<br />
and 50% in 1999 (see Figure 21). Due to their large exposure to the consumer<br />
electronics market, and the intensified competition within that market, we believe<br />
these companies have no choice but to keep spending.<br />
19