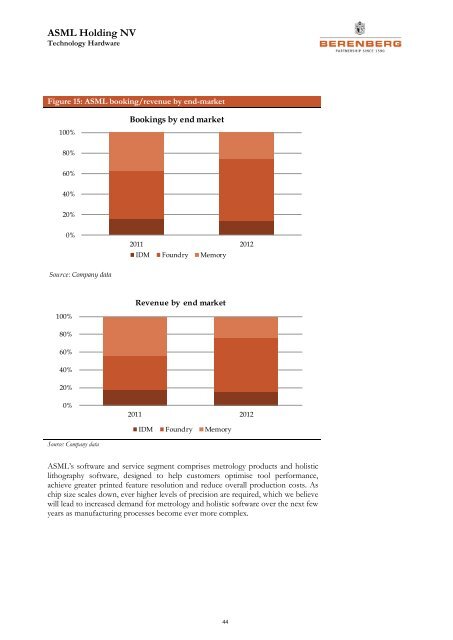
ASML Holding NV Technology Hardware Figure 15: ASML booking/revenue by end-market 100% Bookings by end market 80% 60% 40% 20% 0% 2011 2012 IDM Foundry Memory Source: Company data Revenue by end market 100% 80% 60% 40% 20% 0% 2011 2012 IDM Foundry Memory Source: Company data ASML’s software and service segment comprises metrology products and holistic lithography software, designed to help customers optimise tool performance, achieve greater printed feature resolution and reduce overall production costs. As chip size scales down, ever higher levels of precision are required, which we believe will lead to increased demand for metrology and holistic software over the next few years as manufacturing processes become ever more complex. 44
ASML Holding NV Technology Hardware Figure 16: ASML P&L overview 2011 2012 2013E 2014E 2015E 2016E Tool revenue ex EUV 4,768 3,760 3,660 3,990 3,564 2,801 EUV revenue 116 42 210 1,210 2,300 5,000 Software & Service 767 930 984 1,060 1,140 1,190 Cymer 0 0 180 320 340 355 Total revenues 5,651 4,732 5,034 6,580 7,344 9,346 Gross profit exEUV 2,451 2,005 1,957 2,207 2,041 1,736 Gross margin ex-EUV 44.3% 42.7% 42.1% 43.7% 43.4% 43.5% Gross profit EUV 0 0 53 370 983 2,350 Gross Margin EUV 0.0% 0.0% 25.0% 30.6% 42.7% 47.0% Gross profit Cymer- reported 0 0 -1 125 149 162 Gross margin Cymer- reported 0.0% 0.0% -0.7% 39.0% 43.8% 45.7% Corporate Gross Profit - reported 2,451 2,005 2,008 2,702 3,172 4,249 Corporate Gross Margin reported 43.4% 42.4% 39.9% 41.1% 43.2% 45.5% Corporate Gross Profit - adj 2,450 2,005 2,111 2,754 3,212 4,289 Corporate Gross Margin -adj 43.3% 42.4% 41.9% 41.9% 43.7% 45.9% R&D - adj 590 589 875 920 800 760 SG&A - ajd 219 259 295 304 280 260 Other (income) expenses 0 0 -65 -120 -120 -120 OPEX - Adj 808 848 1,105 1,104 960 900 Op profit - reported 1,641 1,157 880 1,570 2,212 3,349 opm - reported 29.0% 24.4% 17.5% 23.9% 30.1% 35.8% Op profit - adj 1,641 1,157 1,006 1,650 2,252 3,389 opm - adj 29.0% 24.4% 20.0% 25.1% 30.7% 36.3% PBT - reported 1,649 1,151 870 1,570 2,212 3,349 Tax Expense 182 4 62 126 177 335 Effective Tax Rate % 11.0% 0.4% 7.2% 8.0% 8.0% 10.0% Net income - Reported 1,467 1,146 808 1,445 2,035 3,014 Net income - adj 1,467 1,146 925 1,518 2,072 3,050 No of Shares 426 424 420 417 413 410 No. of shares diluted 429 427 424 421 417 414 EPS - Reported 3.42 2.68 1.91 3.43 4.88 7.27 EPS - adj 3.42 2.68 2.18 3.60 4.97 7.36 Source: Company data, <strong>Berenberg</strong> estimates We estimate that ASML’s total revenue to be €5,034m in 2013, and grow at CAGR 23% to reach €9,346m in 2016, driven by EUV tool shipment and high ASP. In 2016, we expect EUV to contribute 54% of total revenue, with revenue from other tools declining over time. We estimate adjusted group gross margins will decline from 42.4% in 2012 to 41.9% in 2013, primarily due to initial EUV shipment at below the group average gross margin (25%). We expect the group gross margin to improve over time due to 1) an EUV gross margin uptick, 2) increased group revenue level leading to leverage, and 3) increased services revenue and Cymer consolidation. 45