Semiconductor Equipment - Berenberg Bank
Semiconductor Equipment - Berenberg Bank
Semiconductor Equipment - Berenberg Bank

You also want an ePaper? Increase the reach of your titles
YUMPU automatically turns print PDFs into web optimized ePapers that Google loves.
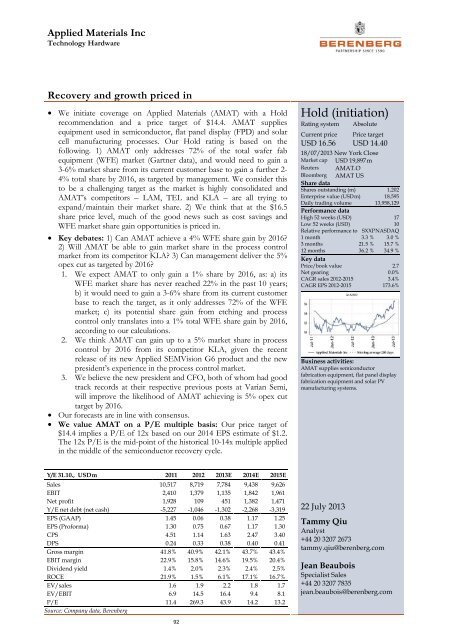
Applied Materials Inc<br />
Technology Hardware<br />
Recovery and growth priced in<br />
• We initiate coverage on Applied Materials (AMAT) with a Hold<br />
recommendation and a price target of $14.4. AMAT supplies<br />
equipment used in semiconductor, flat panel display (FPD) and solar<br />
cell manufacturing processes. Our Hold rating is based on the<br />
following. 1) AMAT only addresses 72% of the total wafer fab<br />
equipment (WFE) market (Gartner data), and would need to gain a<br />
3-6% market share from its current customer base to gain a further 2-<br />
4% total share by 2016, as targeted by management. We consider this<br />
to be a challenging target as the market is highly consolidated and<br />
AMAT’s competitors – LAM, TEL and KLA – are all trying to<br />
expand/maintain their market share. 2) We think that at the $16.5<br />
share price level, much of the good news such as cost savings and<br />
WFE market share gain opportunities is priced in.<br />
• Key debates: 1) Can AMAT achieve a 4% WFE share gain by 2016?<br />
2) Will AMAT be able to gain market share in the process control<br />
market from its competitor KLA? 3) Can management deliver the 5%<br />
opex cut as targeted by 2016?<br />
1. We expect AMAT to only gain a 1% share by 2016, as: a) its<br />
WFE market share has never reached 22% in the past 10 years;<br />
b) it would need to gain a 3-6% share from its current customer<br />
base to reach the target, as it only addresses 72% of the WFE<br />
market; c) its potential share gain from etching and process<br />
control only translates into a 1% total WFE share gain by 2016,<br />
according to our calculations.<br />
2. We think AMAT can gain up to a 5% market share in process<br />
control by 2016 from its competitor KLA, given the recent<br />
release of its new Applied SEMVision G6 product and the new<br />
president’s experience in the process control market.<br />
3. We believe the new president and CFO, both of whom had good<br />
track records at their respective previous posts at Varian Semi,<br />
will improve the likelihood of AMAT achieving is 5% opex cut<br />
target by 2016.<br />
• Our forecasts are in line with consensus.<br />
• We value AMAT on a P/E multiple basis: Our price target of<br />
$14.4 implies a P/E of 12x based on our 2014 EPS estimate of $1.2.<br />
The 12x P/E is the mid-point of the historical 10-14x multiple applied<br />
in the middle of the semiconductor recovery cycle.<br />
Hold (initiation)<br />
Rating system<br />
Current price<br />
USD 16.56<br />
Absolute<br />
Price target<br />
USD 14.40<br />
18/07/2013 New York Close<br />
Market cap USD 19,897 m<br />
Reuters AMAT.O<br />
Bloomberg AMAT US<br />
Share data<br />
Shares outstanding (m) 1,202<br />
Enterprise value (USD m) 18,595<br />
Daily trading volume 13,958,129<br />
Performance data<br />
High 52 weeks (USD) 17<br />
Low 52 weeks (USD) 10<br />
Relative performance to SXXP NASDAQ<br />
1 month 3.3 % 3.0 %<br />
3 months 21.5 % 15.7 %<br />
12 months 36.2 % 34.9 %<br />
Key data<br />
Price/book value 2.7<br />
Net gearing 0.0%<br />
CAGR sales 2012-2015 3.4%<br />
CAGR EPS 2012-2015 173.6%<br />
Business activities:<br />
AMAT supplies semiconductor<br />
fabrication equipment, flat panel display<br />
fabrication equipment and solar PV<br />
manufacturing systems.<br />
Y/E 31.10., USD m 2011 2012 2013E 2014E 2015E<br />
Sales 10,517 8,719 7,784 9,438 9,626<br />
EBIT 2,410 1,379 1,135 1,842 1,961<br />
Net profit 1,928 109 451 1,382 1,471<br />
Y/E net debt (net cash) -5,227 -1,046 -1,302 -2,268 -3,319<br />
EPS (GAAP) 1.45 0.06 0.38 1.17 1.25<br />
EPS (Proforma) 1.30 0.75 0.67 1.17 1.30<br />
CPS 4.51 1.14 1.63 2.47 3.40<br />
DPS 0.24 0.33 0.38 0.40 0.41<br />
Gross margin 41.8% 40.9% 42.1% 43.7% 43.4%<br />
EBIT margin 22.9% 15.8% 14.6% 19.5% 20.4%<br />
Dividend yield 1.4% 2.0% 2.3% 2.4% 2.5%<br />
ROCE 21.9% 1.5% 6.1% 17.1% 16.7%<br />
EV/sales 1.6 1.9 2.2 1.8 1.7<br />
EV/EBIT 6.9 14.5 16.4 9.4 8.1<br />
P/E 11.4 269.3 43.9 14.2 13.2<br />
Source: Company data, <strong>Berenberg</strong><br />
22 July 2013<br />
Tammy Qiu<br />
Analyst<br />
+44 20 3207 2673<br />
tammy.qiu@berenberg.com<br />
Jean Beaubois<br />
Specialist Sales<br />
+44 20 3207 7835<br />
jean.beaubois@berenberg.com<br />
92