Semiconductor Equipment - Berenberg Bank
Semiconductor Equipment - Berenberg Bank
Semiconductor Equipment - Berenberg Bank

You also want an ePaper? Increase the reach of your titles
YUMPU automatically turns print PDFs into web optimized ePapers that Google loves.
<strong>Semiconductor</strong> <strong>Equipment</strong><br />
Technology Hardware<br />
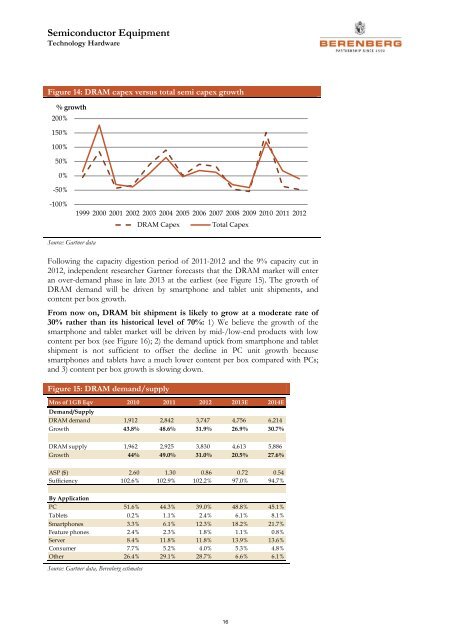
Figure 14: DRAM capex versus total semi capex growth<br />
% growth<br />
200%<br />
150%<br />
100%<br />
50%<br />
0%<br />
-50%<br />
-100%<br />
1999 2000 2001 2002 2003 2004 2005 2006 2007 2008 2009 2010 2011 2012<br />
DRAM Capex<br />
Total Capex<br />
Source: Gartner data<br />
Following the capacity digestion period of 2011-2012 and the 9% capacity cut in<br />
2012, independent researcher Gartner forecasts that the DRAM market will enter<br />
an over-demand phase in late 2013 at the earliest (see Figure 15). The growth of<br />
DRAM demand will be driven by smartphone and tablet unit shipments, and<br />
content per box growth.<br />
From now on, DRAM bit shipment is likely to grow at a moderate rate of<br />
30% rather than its historical level of 70%: 1) We believe the growth of the<br />
smartphone and tablet market will be driven by mid-/low-end products with low<br />
content per box (see Figure 16); 2) the demand uptick from smartphone and tablet<br />
shipment is not sufficient to offset the decline in PC unit growth because<br />
smartphones and tablets have a much lower content per box compared with PCs;<br />
and 3) content per box growth is slowing down.<br />
Figure 15: DRAM demand/supply<br />
Mns of 1GB Eqv 2010 2011 2012 2013E 2014E<br />
Demand/Supply<br />
DRAM demand 1,912 2,842 3,747 4,756 6,214<br />
Growth 43.8% 48.6% 31.9% 26.9% 30.7%<br />
DRAM supply 1,962 2,925 3,830 4,613 5,886<br />
Growth 44% 49.0% 31.0% 20.5% 27.6%<br />
ASP ($) 2.60 1.30 0.86 0.72 0.54<br />
Sufficiency 102.6% 102.9% 102.2% 97.0% 94.7%<br />
By Application<br />
PC 51.6% 44.3% 39.0% 48.8% 45.1%<br />
Tablets 0.2% 1.1% 2.4% 6.1% 8.1%<br />
Smartphones 3.3% 6.1% 12.3% 18.2% 21.7%<br />
Feature phones 2.4% 2.3% 1.8% 1.1% 0.8%<br />
Server 8.4% 11.8% 11.8% 13.9% 13.6%<br />
Consumer 7.7% 5.2% 4.0% 5.3% 4.8%<br />
Other 26.4% 29.1% 28.7% 6.6% 6.1%<br />
Source: Gartner data, <strong>Berenberg</strong> estimates<br />
16