Semiconductor Equipment - Berenberg Bank
Semiconductor Equipment - Berenberg Bank
Semiconductor Equipment - Berenberg Bank

You also want an ePaper? Increase the reach of your titles
YUMPU automatically turns print PDFs into web optimized ePapers that Google loves.
Tokyo Electron Ltd<br />
Technology Hardware<br />
Valuation<br />
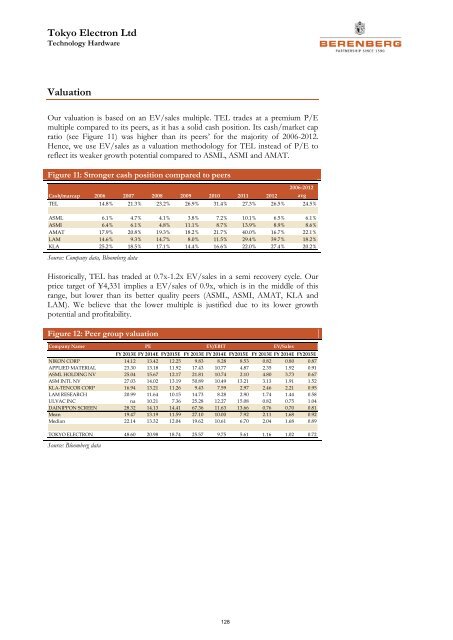
Our valuation is based on an EV/sales multiple. TEL trades at a premium P/E<br />
multiple compared to its peers, as it has a solid cash position. Its cash/market cap<br />
ratio (see Figure 11) was higher than its peers’ for the majority of 2006-2012.<br />
Hence, we use EV/sales as a valuation methodology for TEL instead of P/E to<br />
reflect its weaker growth potential compared to ASML, ASMI and AMAT.<br />
Figure 11: Stronger cash position compared to peers<br />
2006-2012<br />
Cash/marcap 2006 2007 2008 2009 2010 2011 2012 avg<br />
TEL 14.8% 21.3% 23.2% 26.9% 31.4% 27.3% 26.5% 24.5%<br />
ASML 6.1% 4.7% 4.1% 3.8% 7.2% 10.1% 6.5% 6.1%<br />
ASMI 6.4% 6.1% 4.8% 11.1% 8.7% 13.9% 8.9% 8.6%<br />
AMAT 17.9% 20.8% 19.3% 18.2% 21.7% 40.0% 16.7% 22.1%<br />
LAM 14.6% 9.3% 14.7% 8.0% 11.5% 29.4% 39.7% 18.2%<br />
KLA 25.2% 18.5% 17.1% 14.4% 16.6% 22.0% 27.4% 20.2%<br />
Source: Company data, Bloomberg data<br />
Historically, TEL has traded at 0.7x-1.2x EV/sales in a semi recovery cycle. Our<br />
price target of ¥4,331 implies a EV/sales of 0.9x, which is in the middle of this<br />
range, but lower than its better quality peers (ASML, ASMI, AMAT, KLA and<br />
LAM). We believe that the lower multiple is justified due to its lower growth<br />
potential and profitability.<br />
Figure 12: Peer group valuation<br />
Company Name PE EV/EBIT EV/Sales<br />
FY 2013E FY 2014E FY2015E FY 2013E FY 2014E FY2015E FY 2013E FY 2014E FY2015E<br />
NIKON CORP 14.12 13.42 12.25 9.83 8.28 8.53 0.82 0.80 0.87<br />
APPLIED MATERIAL 23.30 13.18 11.92 17.43 10.77 4.87 2.35 1.92 0.91<br />
ASML HOLDING NV 25.04 15.67 12.17 21.81 10.74 2.10 4.80 3.73 0.67<br />
ASM INTL NV 27.03 14.02 13.19 50.89 10.49 13.21 3.13 1.91 1.52<br />
KLA-TENCOR CORP 16.94 13.21 11.26 9.43 7.59 2.97 2.46 2.21 0.95<br />
LAM RESEARCH 20.99 11.64 10.15 14.73 8.28 2.90 1.74 1.44 0.58<br />
ULVAC INC na 10.21 7.36 25.28 12.27 15.08 0.82 0.75 1.04<br />
DAINIPPON SCREEN 28.32 14.13 14.41 67.36 11.63 13.66 0.76 0.70 0.81<br />
Mean 19.47 13.19 11.59 27.10 10.00 7.92 2.11 1.68 0.92<br />
Median 22.14 13.32 12.04 19.62 10.61 6.70 2.04 1.68 0.89<br />
TOKYO ELECTRON 48.60 20.98 18.74 25.57 9.75 5.61 1.16 1.02 0.72<br />
Source: Bloomberg data<br />
128