Semiconductor Equipment - Berenberg Bank
Semiconductor Equipment - Berenberg Bank
Semiconductor Equipment - Berenberg Bank

Create successful ePaper yourself
Turn your PDF publications into a flip-book with our unique Google optimized e-Paper software.
<strong>Semiconductor</strong> <strong>Equipment</strong><br />
Technology Hardware<br />
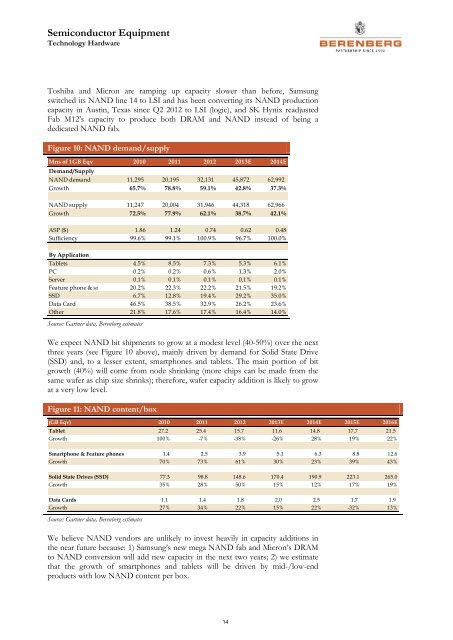
Toshiba and Micron are ramping up capacity slower than before, Samsung<br />
switched its NAND line 14 to LSI and has been converting its NAND production<br />
capacity in Austin, Texas since Q2 2012 to LSI (logic), and SK Hynix readjusted<br />
Fab M12’s capacity to produce both DRAM and NAND instead of being a<br />
dedicated NAND fab.<br />
Figure 10: NAND demand/supply<br />
Mns of 1GB Eqv 2010 2011 2012 2013E 2014E<br />
Demand/Supply<br />
NAND demand 11,295 20,195 32,131 45,872 62,992<br />
Growth 65.7% 78.8% 59.1% 42.8% 37.3%<br />
NAND supply 11,247 20,004 31,946 44,318 62,966<br />
Growth 72.5% 77.9% 62.1% 38.7% 42.1%<br />
ASP ($) 1.86 1.24 0.74 0.62 0.48<br />
Sufficiency 99.6% 99.1% 100.9% 96.7% 100.0%<br />
By Application<br />
Tablets 4.5% 8.5% 7.3% 5.3% 6.1%<br />
PC 0.2% 0.2% 0.6% 1.3% 2.0%<br />
Server 0.1% 0.1% 0.1% 0.1% 0.1%<br />
Feature phone & sm 20.2% 22.3% 22.2% 21.5% 19.2%<br />
SSD 6.7% 12.8% 19.4% 29.2% 35.0%<br />
Data Card 46.5% 38.5% 32.9% 26.2% 23.6%<br />
Other 21.8% 17.6% 17.4% 16.4% 14.0%<br />
Source: Gartner data, <strong>Berenberg</strong> estimates<br />
We expect NAND bit shipments to grow at a modest level (40-50%) over the next<br />
three years (see Figure 10 above), mainly driven by demand for Solid State Drive<br />
(SSD) and, to a lesser extent, smartphones and tablets. The main portion of bit<br />
growth (40%) will come from node shrinking (more chips can be made from the<br />
same wafer as chip size shrinks); therefore, wafer capacity addition is likely to grow<br />
at a very low level.<br />
Figure 11: NAND content/box<br />
(GB Eqv) 2010 2011 2012 2013E 2014E 2015E 2016E<br />
Tablet 27.2 25.4 15.7 11.6 14.8 17.7 21.5<br />
Growth 100% -7% -38% -26% 28% 19% 22%<br />
Smartphone & Feature phones 1.4 2.5 3.9 5.1 6.3 8.8 12.6<br />
Growth 70% 73% 61% 30% 23% 39% 43%<br />
Solid State Drives (SSD) 77.3 98.8 148.6 170.4 190.9 223.1 265.0<br />
Growth 35% 28% 50% 15% 12% 17% 19%<br />
Data Cards 1.1 1.4 1.8 2.0 2.5 1.7 1.9<br />
Growth 27% 34% 22% 15% 22% -32% 13%<br />
Source: Gartner data, <strong>Berenberg</strong> estimates<br />
We believe NAND vendors are unlikely to invest heavily in capacity additions in<br />
the near future because: 1) Samsung’s new mega NAND fab and Micron’s DRAM<br />
to NAND conversion will add new capacity in the next two years; 2) we estimate<br />
that the growth of smartphones and tablets will be driven by mid-/low-end<br />
products with low NAND content per box.<br />
14