Complete Document - City of Auburn
Complete Document - City of Auburn
Complete Document - City of Auburn

Create successful ePaper yourself
Turn your PDF publications into a flip-book with our unique Google optimized e-Paper software.
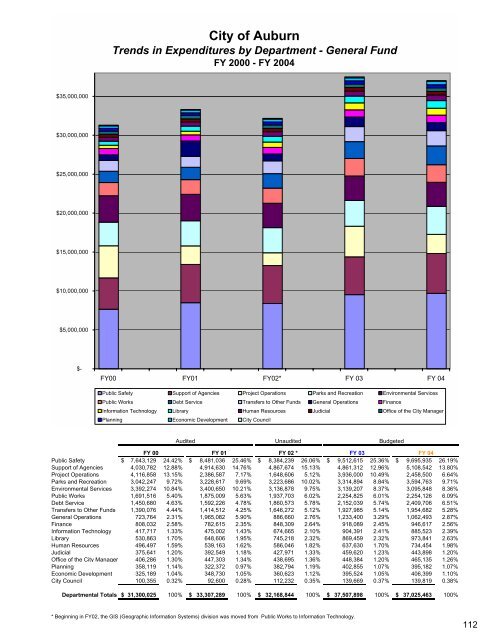
<strong>City</strong> <strong>of</strong> <strong>Auburn</strong>Trends in Expenditures by Department - General FundFY 2000 - FY 2004$35,000,000$30,000,000$25,000,000$20,000,000$15,000,000$10,000,000$5,000,000$-FY00 FY01 FY02* FY 03 FY 04Public Safety Support <strong>of</strong> Agencies Project Operations Parks and Recreation Environmental ServicesPublic Works Debt Service Transfers to Other Funds General Operations FinanceInformation Technology Library Human Resources Judicial Office <strong>of</strong> the <strong>City</strong> ManagerPlanning Economic Development <strong>City</strong> CouncilAuditedUnauditedBudgetedFY 00 FY 01FY 02 * FY 03 FY 04Public Safety $ 7,643,129 24.42% $ 8,481,036 25.46% $ 8,384,239 26.06% $ 9,512,615 25.36% $ 9,695,935 26.19%Support <strong>of</strong> Agencies 4,030,782 12.88% 4,914,630 14.76% 4,867,674 15.13% 4,861,312 12.96% 5,108,542 13.80%Project Operations 4,116,858 13.15% 2,386,587 7.17% 1,648,606 5.12% 3,936,000 10.49% 2,458,500 6.64%Parks and Recreation 3,042,247 9.72% 3,228,617 9.69% 3,223,686 10.02% 3,314,894 8.84% 3,594,763 9.71%Environmental Services 3,392,274 10.84% 3,400,650 10.21% 3,136,878 9.75% 3,139,207 8.37% 3,095,848 8.36%Public Works 1,691,516 5.40% 1,875,009 5.63% 1,937,703 6.02% 2,254,825 6.01% 2,254,126 6.09%Debt Service 1,450,680 4.63% 1,592,226 4.78% 1,860,573 5.78% 2,152,039 5.74% 2,409,706 6.51%Transfers to Other Funds 1,390,076 4.44% 1,414,512 4.25% 1,646,272 5.12% 1,927,985 5.14% 1,954,682 5.28%General Operations 723,764 2.31% 1,965,082 5.90% 886,660 2.76% 1,233,400 3.29% 1,062,493 2.87%Finance 808,032 2.58% 782,615 2.35% 848,309 2.64% 918,089 2.45% 946,617 2.56%Information Technology 417,717 1.33% 475,002 1.43% 674,665 2.10% 904,391 2.41% 885,523 2.39%Library 530,863 1.70% 648,606 1.95% 745,218 2.32% 869,459 2.32% 973,841 2.63%Human Resources 496,497 1.59% 539,163 1.62% 586,046 1.82% 637,630 1.70% 734,454 1.98%Judicial 375,641 1.20% 392,549 1.18% 427,971 1.33% 459,620 1.23% 443,898 1.20%Office <strong>of</strong> the <strong>City</strong> Manager 406,286 1.30% 447,303 1.34% 438,695 1.36% 448,384 1.20% 465,135 1.26%Planning 358,119 1.14% 322,372 0.97% 382,794 1.19% 402,855 1.07% 395,182 1.07%Economic Development 325,189 1.04% 348,730 1.05% 360,623 1.12% 395,524 1.05% 406,399 1.10%<strong>City</strong> Council 100,355 0.32% 92,600 0.28% 112,232 0.35% 139,669 0.37% 139,819 0.38%Departmental Totals $ 31,300,025 100% $ 33,307,289 100% $ 32,168,844 100% $ 37,507,898 100% $ 37,025,463 100%* Beginning in FY02, the GIS (Geographic Information Systems) division was moved from Public Works to Information Technology.112