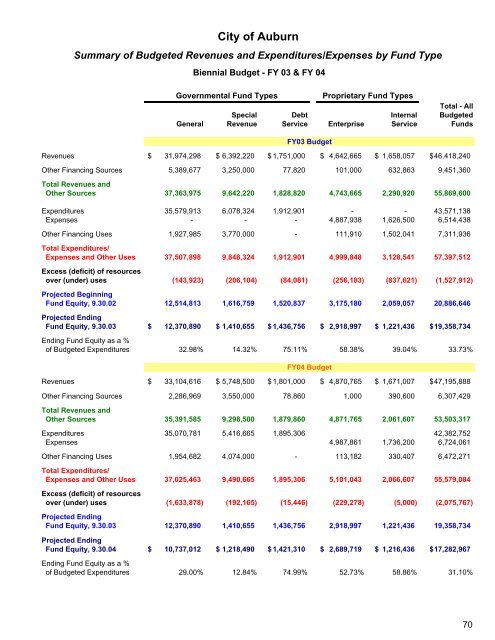
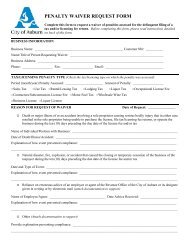
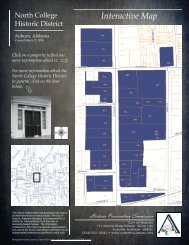
<strong>City</strong> <strong>of</strong> <strong>Auburn</strong>Overview <strong>of</strong> Projected Resources and Planned Spending ~ All Budgeted FundsBiennial Budget - FY 03 & FY 04$60,000,000$2,290,920$3,128,541$2,066,607$4,743,665$4,999,848$2,061,607$5,101,043$50,000,000$1,828,820$1,912,901$4,871,765$1,879,860$1,895,306$40,000,000$9,642,220$9,848,324$9,298,500$9,490,665$30,000,000$20,000,000$37,363,975$37,507,898$35,391,585$37,025,463$10,000,000$-FY 03 Resources FY 03 Spending FY 04 Resources FY 04 SpendingGeneral Fund Resources Special Revenue Funds Resources Debt Service Funds ResourcesEnterprise Funds Resources Internal Service Funds Resources General Fund SpendingSpecial Revenue Funds Spending Debt Service Funds Spending Enterprise Funds SpendingInternal Service Funds Spending69
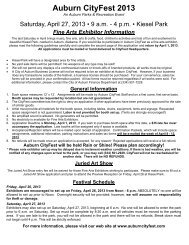
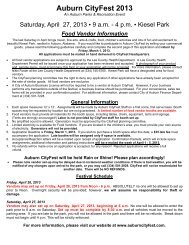
<strong>City</strong> <strong>of</strong> <strong>Auburn</strong>Summary <strong>of</strong> Budgeted Revenues and Expenditures/Expenses by Fund TypeBiennial Budget - FY 03 & FY 04Governmental Fund TypesProprietary Fund TypesTotal - AllSpecial Debt Internal BudgetedGeneral Revenue Service Enterprise Service FundsFY03 BudgetRevenues $ 31,974,298 $ 6,392,220 $ 1,751,000 $ 4,642,665 $ 1,658,057 $ 46,418,240Other Financing Sources 5,389,677 3,250,000 77,820 101,000 632,863 9,451,360Total Revenues andOther Sources 37,363,975 9,642,220 1,828,820 4,743,665 2,290,920 55,869,600Expenditures 35,579,913 6,078,324 1,912,901 - - 43,571,138Expenses - - - 4,887,938 1,626,500 6,514,438Other Financing Uses 1,927,985 3,770,000 - 111,910 1,502,041 7,311,936Total Expenditures/Expenses and Other Uses 37,507,898 9,848,324 1,912,901 4,999,848 3,128,541 57,397,512Excess (deficit) <strong>of</strong> resourcesover (under) uses (143,923) (206,104) (84,081) (256,183) (837,621) (1,527,912)Projected BeginningFund Equity, 9.30.02 12,514,813 1,616,759 1,520,837 3,175,180 2,059,057 20,886,646Projected EndingFund Equity, 9.30.03 $ 12,370,890 $ 1,410,655 $ 1,436,756 $ 2,918,997 $ 1,221,436 $ 19,358,734Ending Fund Equity as a %<strong>of</strong> Budgeted Expenditures 32.98% 14.32% 75.11% 58.38% 39.04% 33.73%FY04 BudgetRevenues $ 33,104,616 $ 5,748,500 $ 1,801,000 $ 4,870,765 $ 1,671,007 $ 47,195,888Other Financing Sources 2,286,969 3,550,000 78,860 1,000 390,600 6,307,429Total Revenues andOther Sources 35,391,585 9,298,500 1,879,860 4,871,765 2,061,607 53,503,317Expenditures 35,070,781 5,416,665 1,895,306 42,382,752Expenses 4,987,861 1,736,200 6,724,061Other Financing Uses 1,954,682 4,074,000 - 113,182 330,407 6,472,271Total Expenditures/Expenses and Other Uses 37,025,463 9,490,665 1,895,306 5,101,043 2,066,607 55,579,084Excess (deficit) <strong>of</strong> resourcesover (under) uses (1,633,878) (192,165) (15,446) (229,278) (5,000) (2,075,767)Projected EndingFund Equity, 9.30.03 12,370,890 1,410,655 1,436,756 2,918,997 1,221,436 19,358,734Projected EndingFund Equity, 9.30.04 $ 10,737,012 $ 1,218,490 $ 1,421,310 $ 2,689,719 $ 1,216,436 $ 17,282,967Ending Fund Equity as a %<strong>of</strong> Budgeted Expenditures 29.00% 12.84% 74.99% 52.73% 58.86% 31.10%70
- Page 1:
TheCity of AuburnAlabamaBiennial Bu
- Page 4 and 5:
City of Auburn General Fund (contin
- Page 6 and 7:
City of AuburnFY 03 & FY 04Biennial
- Page 8 and 9:
City of Auburn, AlabamaApproximatel
- Page 10 and 11:
City of Auburn, Alabamaachievements
- Page 14 and 15:
City of Auburn, Alabama• The annu
- Page 16 and 17:
Miscellaneous Statistical DataAubur
- Page 18 and 19:
City of AuburnPersonnel Summary by
- Page 20 and 21:
City of AuburnFY03 & FY04Biennial B
- Page 22 and 23:
City of AuburnFY03 & FY04Biennial B
- Page 24 and 25:
City of AuburnFY03 & FY04Biennial B
- Page 26 and 27: The Government Finance Officers Ass
- Page 28 and 29: Budget Message (continued) May 28,
- Page 30 and 31: Budget Message (continued) May 28,
- Page 32 and 33: Budget Message (continued) May 28,
- Page 34 and 35: Budget Message (continued) May 28,
- Page 36 and 37: Budget Message (continued) May 28,
- Page 38 and 39: Budget Message (continued) May 28,
- Page 40 and 41: Budget Message (continued) May 28,
- Page 42 and 43: City of Auburn Key Decisions of the
- Page 44 and 45: City of AuburnFinancial OverviewThe
- Page 46 and 47: City of AuburnFinancial Overview$40
- Page 48 and 49: 41City of Auburn ~ General Fund ~ S
- Page 50 and 51: The City of AuburnDescription of th
- Page 52 and 53: City of Auburnexpenditures by fund
- Page 54 and 55: City of AuburnBiennial Budget Calen
- Page 56 and 57: City of AuburnAnnual Citizen Survey
- Page 58 and 59: City of AuburnAmong the following s
- Page 60 and 61: Auburn 202022 Goals for 2020The Aub
- Page 62 and 63: City of AuburnRevenue Overview• a
- Page 64 and 65: City of AuburnRevenue Overviewincre
- Page 66 and 67: City of AuburnRevenue OverviewCity
- Page 68 and 69: City of AuburnOverview of Debt Poli
- Page 70 and 71: City of AuburnOverview of Debt Poli
- Page 72 and 73: City of AuburnOverview of Debt Poli
- Page 74 and 75: City of AuburnOverview of Debt Poli
- Page 78 and 79: City of AuburnDetails of Financing
- Page 80 and 81: PublicTotal-AllSpecial Safety Budge
- Page 82 and 83: City of AuburnOverview of Other Fun
- Page 84 and 85: City of AuburnSummary of Capital Ou
- Page 86 and 87: City of AuburnSummary of Capital Ou
- Page 88 and 89: City of AuburnSummary of Capital Ou
- Page 90 and 91: City of AuburnSummary of Capital Ou
- Page 92 and 93: City of AuburnSummary of Capital Ou
- Page 94 and 95: City of AuburnCapital Improvements
- Page 96 and 97: City of AuburnCapital Improvements
- Page 98 and 99: City of AuburnFY 03 & FY 04Biennial
- Page 100 and 101: City of AuburnTrends in Total Reven
- Page 102 and 103: The City of AuburnGeneral Fund - Su
- Page 104 and 105: City of AuburnGeneral Fund - Detail
- Page 106 and 107: City of AuburnGeneral Fund - Detail
- Page 108 and 109: City of AuburnOverview of Expenditu
- Page 110 and 111: City of AuburnDetail of Expenditure
- Page 112 and 113: City of AuburnDetails of Expenditur
- Page 114 and 115: City of AuburnSummary of Expenditur
- Page 116 and 117: City of AuburnGeneral Fund - Summar
- Page 118 and 119: City of AuburnComparative Budgeted
- Page 120 and 121: City of AuburnBiennial BudgetTable
- Page 122 and 123: City of AuburnOverview of Expenditu
- Page 124 and 125: City CouncilBudget SummaryBiennial
- Page 126 and 127:
Office of the City ManagerDouglas J
- Page 128 and 129:
Office of the City ManagerBudget Su
- Page 130 and 131:
GENERAL FUNDExpendituresCity Manage
- Page 132 and 133:
Judicial DepartmentJoe Bailey, Muni
- Page 134 and 135:
GENERAL FUNDExpendituresJudicialCla
- Page 136 and 137:
Information Technology DepartmentJa
- Page 138 and 139:
Information TechnologyBudget Summar
- Page 140 and 141:
GENERAL FUNDExpendituresInformation
- Page 142 and 143:
GENERAL FUNDExpendituresInformation
- Page 144 and 145:
Finance DepartmentAndrea E. Jackson
- Page 146 and 147:
Finance DepartmentAndrea Jackson, D
- Page 148 and 149:
GENERAL FUNDExpendituresFinanceClas
- Page 150 and 151:
Economic DevelopmentDepartmentPhill
- Page 152 and 153:
Economic Development DepartmentPhil
- Page 154 and 155:
GENERAL FUNDExpendituresEconomic De
- Page 156 and 157:
Human Resources DepartmentSteven A.
- Page 158 and 159:
Human Resources DepartmentHuman Res
- Page 160 and 161:
GENERAL FUNDExpendituresHuman Resou
- Page 162 and 163:
GENERAL FUNDExpendituresHuman Resou
- Page 164 and 165:
City of Auburn Public Safety Depart
- Page 166 and 167:
Public Safety Department Mission an
- Page 168 and 169:
GENERAL FUNDExpendituresPublic Safe
- Page 170 and 171:
Public Safety DepartmentPolice Divi
- Page 172 and 173:
GENERAL FUNDExpendituresPublic Safe
- Page 174 and 175:
GENERAL FUNDExpendituresPublic Safe
- Page 176 and 177:
Public Safety DepartmentCommunicati
- Page 178 and 179:
Public Safety DepartmentCodes Enfor
- Page 180 and 181:
Public Works DepartmentJeff Ramsey,
- Page 182 and 183:
Public Works DepartmentAdministrati
- Page 184 and 185:
GENERAL FUNDExpendituresPublic Work
- Page 186 and 187:
GENERAL FUNDExpendituresPublic Work
- Page 188 and 189:
Public Works DepartmentEngineering
- Page 190 and 191:
Public Works DepartmentInspection D
- Page 192 and 193:
GENERAL FUNDExpendituresPublic Work
- Page 194 and 195:
GENERAL FUNDExpendituresPublic Work
- Page 196 and 197:
Environmental Services DepartmentAl
- Page 198 and 199:
GENERAL FUNDExpendituresEnvironment
- Page 200 and 201:
Environmental Services DepartmentRe
- Page 202 and 203:
GENERAL FUNDExpendituresEnvironment
- Page 204 and 205:
GENERAL FUNDExpendituresEnvironment
- Page 206 and 207:
Environmental Services DepartmentAn
- Page 208 and 209:
Environmental Services DepartmentRi
- Page 210 and 211:
GENERAL FUNDExpendituresEnvironment
- Page 212 and 213:
GENERAL FUNDExpendituresEnvironment
- Page 214 and 215:
Auburn City LibraryMargie B. Huffma
- Page 216 and 217:
LibraryBudget SummaryBiennial Budge
- Page 218 and 219:
GENERAL FUNDExpendituresLibrary (co
- Page 220 and 221:
Parks and Recreation DepartmentRebe
- Page 222 and 223:
GENERAL FUNDExpendituresParks and R
- Page 224 and 225:
Parks and Recreation DepartmentLeis
- Page 226 and 227:
Parks and Recreation DepartmentPark
- Page 228 and 229:
GENERAL FUNDExpendituresParks and R
- Page 230 and 231:
Planning DepartmentRobert J. Juster
- Page 232 and 233:
GENERAL FUNDExpendituresPlanningCla
- Page 234 and 235:
Non-DepartmentalBudget SummaryBienn
- Page 236 and 237:
GENERAL FUNDExpendituresNon Departm
- Page 238 and 239:
GENERAL FUNDExpendituresNon Departm
- Page 240 and 241:
GENERAL FUNDExpendituresNon Departm
- Page 242 and 243:
Water and Sewer DepartmentRex Griff
- Page 244 and 245:
City of AuburnOverview of Sewer Fun
- Page 246 and 247:
SEWER FUNDExpendituresSewer Mainten
- Page 248 and 249:
Sewer FundSewer General Operations
- Page 250 and 251:
SEWER CAPITALPROJECTS FUNDExpenditu
- Page 252 and 253:
City of AuburnDescription of and Tr
- Page 254 and 255:
City of AuburnTotal Special Revenue
- Page 256 and 257:
City of AuburnCity Gas Tax Special
- Page 258 and 259:
City of AuburnState Nine Cent Gas T
- Page 260 and 261:
City of AuburnSpecial Additional Sc
- Page 262 and 263:
City of AuburnCommunity Development
- Page 264 and 265:
City of AuburnDescription of and Tr
- Page 266 and 267:
City of AuburnTotal Debt Service Fu
- Page 268 and 269:
City of AuburnSpecial Five Mill Tax
- Page 270 and 271:
City of AuburnFY 03 & FY 04Biennial
- Page 272 and 273:
City of AuburnOverview of Total Ent
- Page 274 and 275:
City of AuburnDetail of Enterprise
- Page 276 and 277:
City of AuburnSewer Equipment Repla
- Page 278 and 279:
City of AuburnIndustrial Park FundC
- Page 280 and 281:
City of AuburnDescription of and Tr
- Page 282 and 283:
City of AuburnTotal Internal Servic
- Page 284 and 285:
City of AuburnLiability Risk Retent