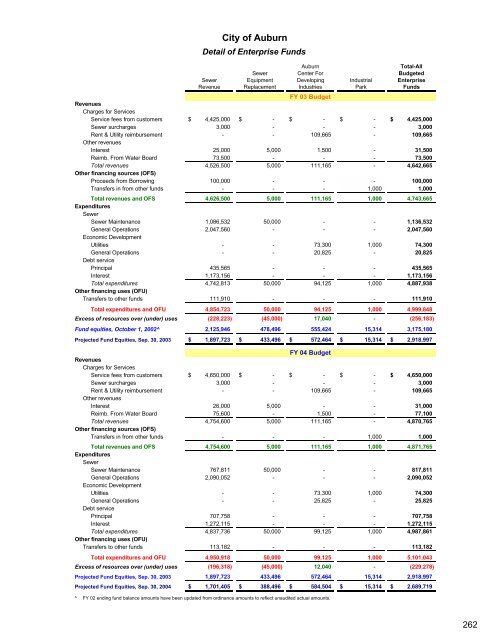
<strong>City</strong> <strong>of</strong> <strong>Auburn</strong>Detail <strong>of</strong> Enterprise Funds<strong>Auburn</strong>Total-AllSewer Center For BudgetedSewer Equipment Developing Industrial EnterpriseRevenue Replacement Industries Park FundsFY 03 BudgetRevenuesCharges for ServicesService fees from customers $ 4,425,000 $ - $ - $ - $ 4,425,000Sewer surcharges 3,000 - - - 3,000Rent & Utility reimbursement - - 109,665 - 109,665Other revenuesInterest 25,000 5,000 1,500 - 31,500Reimb. From Water Board 73,500 - - - 73,500Total revenues 4,526,500 5,000 111,165 - 4,642,665Other financing sources (OFS)Proceeds from Borrowing 100,000 - - - 100,000Transfers in from other funds - - - 1,000 1,000Total revenues and OFS 4,626,500 5,000 111,165 1,000 4,743,665ExpendituresSewerSewer Maintenance 1,086,532 50,000 - - 1,136,532General Operations 2,047,560 - - - 2,047,560Economic DevelopmentUtilities - - 73,300 1,000 74,300General Operations - - 20,825 - 20,825Debt servicePrincipal 435,565 - - - 435,565Interest 1,173,156 - - - 1,173,156Total expenditures 4,742,813 50,000 94,125 1,000 4,887,938Other financing uses (OFU)Transfers to other funds111,910 - - - 111,910Total expenditures and OFU 4,854,723 50,000 94,125 1,000 4,999,848Excess <strong>of</strong> resources over (under) uses(228,223) (45,000) 17,040 - (256,183)Fund equities, October 1, 2002^ 2,125,946 478,496 555,424 15,314 3,175,180Projected Fund Equities, Sep. 30, 2003 $ 1,897,723 $ 433,496 $ 572,464 $ 15,314 $ 2,918,997FY 04 BudgetRevenuesCharges for ServicesService fees from customers $ 4,650,000 $ - $ - $ - $ 4,650,000Sewer surcharges 3,000 - - - 3,000Rent & Utility reimbursement - - 109,665 - 109,665Other revenuesInterest 26,000 5,000 - - 31,000Reimb. From Water Board 75,600 - 1,500 - 77,100Total revenues 4,754,600 5,000 111,165 - 4,870,765Other financing sources (OFS)Transfers in from other funds - - - 1,000 1,000Total revenues and OFS 4,754,600 5,000 111,165 1,000 4,871,765ExpendituresSewerSewer Maintenance 767,811 50,000 - - 817,811General Operations 2,090,052 - - - 2,090,052Economic DevelopmentUtilities - - 73,300 1,000 74,300General Operations - - 25,825 - 25,825Debt servicePrincipal 707,758 - - - 707,758Interest 1,272,115 - - - 1,272,115Total expenditures 4,837,736 50,000 99,125 1,000 4,987,861Other financing uses (OFU)Transfers to other funds113,182 - - - 113,182Total expenditures and OFU 4,950,918 50,000 99,125 1,000 5,101,043Excess <strong>of</strong> resources over (under) uses (196,318) (45,000) 12,040 - (229,278)Projected Fund Equities, Sep. 30, 20031,897,723 433,496 572,464 15,314 2,918,997Projected Fund Equities, Sep. 30, 2004 $ 1,701,405 $ 388,496 $ 584,504 $ 15,314 $ 2,689,719^FY 02 ending fund balance amounts have been updated from ordinance amounts to reflect unaudited actual amounts.262
<strong>City</strong> <strong>of</strong> <strong>Auburn</strong>Sewer Revenue FundComparative Revenues, Expenditures and Changes in Fund BalancesActualFive YearBudgeted^(Unaudited)Actual (Audited)PercentFY 04 FY 03 FY02 FY01 FY00 ChangeRevenues:Charges for ServicesSewer fees from customers $ 4,650,000 $ 4,425,000 $ 4,841,030 $ 4,515,765 $ 4,960,076 -6.25%Sewer surcharges 3,000 3,000 - 7,340 3,102 -3.29%Other revenuesInterest 26,000 25,000 30,876 39,808 43,384 -40.07%Reimb. from outside agencies 75,600 73,500 71,250 - - n/aTotal revenues 4,754,600 4,526,500 4,943,156 4,562,913 5,006,562 -5.03%Other financing sources (OFS):Proceeds from Borrowing - 100,000 - - - n/aTransfers in from other funds - - 24,773 - - n/aCapital Contributions - - 788,275 504,310 - n/aTotal revenues and OFS 4,754,600 4,626,500 5,756,204 5,067,223 5,006,562 -5.03%Expenditures:SewerSewer Maintenance 767,811 1,086,532 683,791 1,029,278 942,784 -18.56%General Operations2,090,052 2,047,560 2,052,718 3,439,947 3,709,852 -43.66%Debt ServicePrinicipal 707,758 435,565 561,552 - - n/aInterest 1,272,115 1,173,156 1,128,119 142,525 8,338 15157%Total expenditures 4,837,736 4,742,813 4,426,180 4,611,750 4,660,974Other financing uses (OFU):Operating transfers to other funds 113,182 111,910 71,250 71,250 71,250 58.85%Loss on disposal <strong>of</strong> fixed assets - - - - 6,231 -100.00%Total expenditures and OFU 4,950,918 4,854,723 4,497,430 4,683,000 4,738,455 4.48%Excess <strong>of</strong> revenues and other sourcesover expenditures and other uses (196,318) (228,223) 1,258,774 384,223 268,107 -173.22%Fund equity, beginning <strong>of</strong> year 1,897,723 2,125,946 867,172 447,746 179,639 -956.41%Prior period adjustments - - - 27,494 - n/aResidual equity transfer in (out) - - - 7,709 - n/aFund equity, end <strong>of</strong> year $ 1,701,405 $ 1,897,723 $ 2,125,946 $ 867,172 $ 447,746 279.99%^ Beginning and ending fund balances for budgeted years have been updated from budget ordinance amounts to reflect actualunaudited ending fund balance at September 30, 2002.263
- Page 1:
TheCity of AuburnAlabamaBiennial Bu
- Page 4 and 5:
City of Auburn General Fund (contin
- Page 6 and 7:
City of AuburnFY 03 & FY 04Biennial
- Page 8 and 9:
City of Auburn, AlabamaApproximatel
- Page 10 and 11:
City of Auburn, Alabamaachievements
- Page 14 and 15:
City of Auburn, Alabama• The annu
- Page 16 and 17:
Miscellaneous Statistical DataAubur
- Page 18 and 19:
City of AuburnPersonnel Summary by
- Page 20 and 21:
City of AuburnFY03 & FY04Biennial B
- Page 22 and 23:
City of AuburnFY03 & FY04Biennial B
- Page 24 and 25:
City of AuburnFY03 & FY04Biennial B
- Page 26 and 27:
The Government Finance Officers Ass
- Page 28 and 29:
Budget Message (continued) May 28,
- Page 30 and 31:
Budget Message (continued) May 28,
- Page 32 and 33:
Budget Message (continued) May 28,
- Page 34 and 35:
Budget Message (continued) May 28,
- Page 36 and 37:
Budget Message (continued) May 28,
- Page 38 and 39:
Budget Message (continued) May 28,
- Page 40 and 41:
Budget Message (continued) May 28,
- Page 42 and 43:
City of Auburn Key Decisions of the
- Page 44 and 45:
City of AuburnFinancial OverviewThe
- Page 46 and 47:
City of AuburnFinancial Overview$40
- Page 48 and 49:
41City of Auburn ~ General Fund ~ S
- Page 50 and 51:
The City of AuburnDescription of th
- Page 52 and 53:
City of Auburnexpenditures by fund
- Page 54 and 55:
City of AuburnBiennial Budget Calen
- Page 56 and 57:
City of AuburnAnnual Citizen Survey
- Page 58 and 59:
City of AuburnAmong the following s
- Page 60 and 61:
Auburn 202022 Goals for 2020The Aub
- Page 62 and 63:
City of AuburnRevenue Overview• a
- Page 64 and 65:
City of AuburnRevenue Overviewincre
- Page 66 and 67:
City of AuburnRevenue OverviewCity
- Page 68 and 69:
City of AuburnOverview of Debt Poli
- Page 70 and 71:
City of AuburnOverview of Debt Poli
- Page 72 and 73:
City of AuburnOverview of Debt Poli
- Page 74 and 75:
City of AuburnOverview of Debt Poli
- Page 76 and 77:
City of AuburnOverview of Projected
- Page 78 and 79:
City of AuburnDetails of Financing
- Page 80 and 81:
PublicTotal-AllSpecial Safety Budge
- Page 82 and 83:
City of AuburnOverview of Other Fun
- Page 84 and 85:
City of AuburnSummary of Capital Ou
- Page 86 and 87:
City of AuburnSummary of Capital Ou
- Page 88 and 89:
City of AuburnSummary of Capital Ou
- Page 90 and 91:
City of AuburnSummary of Capital Ou
- Page 92 and 93:
City of AuburnSummary of Capital Ou
- Page 94 and 95:
City of AuburnCapital Improvements
- Page 96 and 97:
City of AuburnCapital Improvements
- Page 98 and 99:
City of AuburnFY 03 & FY 04Biennial
- Page 100 and 101:
City of AuburnTrends in Total Reven
- Page 102 and 103:
The City of AuburnGeneral Fund - Su
- Page 104 and 105:
City of AuburnGeneral Fund - Detail
- Page 106 and 107:
City of AuburnGeneral Fund - Detail
- Page 108 and 109:
City of AuburnOverview of Expenditu
- Page 110 and 111:
City of AuburnDetail of Expenditure
- Page 112 and 113:
City of AuburnDetails of Expenditur
- Page 114 and 115:
City of AuburnSummary of Expenditur
- Page 116 and 117:
City of AuburnGeneral Fund - Summar
- Page 118 and 119:
City of AuburnComparative Budgeted
- Page 120 and 121:
City of AuburnBiennial BudgetTable
- Page 122 and 123:
City of AuburnOverview of Expenditu
- Page 124 and 125:
City CouncilBudget SummaryBiennial
- Page 126 and 127:
Office of the City ManagerDouglas J
- Page 128 and 129:
Office of the City ManagerBudget Su
- Page 130 and 131:
GENERAL FUNDExpendituresCity Manage
- Page 132 and 133:
Judicial DepartmentJoe Bailey, Muni
- Page 134 and 135:
GENERAL FUNDExpendituresJudicialCla
- Page 136 and 137:
Information Technology DepartmentJa
- Page 138 and 139:
Information TechnologyBudget Summar
- Page 140 and 141:
GENERAL FUNDExpendituresInformation
- Page 142 and 143:
GENERAL FUNDExpendituresInformation
- Page 144 and 145:
Finance DepartmentAndrea E. Jackson
- Page 146 and 147:
Finance DepartmentAndrea Jackson, D
- Page 148 and 149:
GENERAL FUNDExpendituresFinanceClas
- Page 150 and 151:
Economic DevelopmentDepartmentPhill
- Page 152 and 153:
Economic Development DepartmentPhil
- Page 154 and 155:
GENERAL FUNDExpendituresEconomic De
- Page 156 and 157:
Human Resources DepartmentSteven A.
- Page 158 and 159:
Human Resources DepartmentHuman Res
- Page 160 and 161:
GENERAL FUNDExpendituresHuman Resou
- Page 162 and 163:
GENERAL FUNDExpendituresHuman Resou
- Page 164 and 165:
City of Auburn Public Safety Depart
- Page 166 and 167:
Public Safety Department Mission an
- Page 168 and 169:
GENERAL FUNDExpendituresPublic Safe
- Page 170 and 171:
Public Safety DepartmentPolice Divi
- Page 172 and 173:
GENERAL FUNDExpendituresPublic Safe
- Page 174 and 175:
GENERAL FUNDExpendituresPublic Safe
- Page 176 and 177:
Public Safety DepartmentCommunicati
- Page 178 and 179:
Public Safety DepartmentCodes Enfor
- Page 180 and 181:
Public Works DepartmentJeff Ramsey,
- Page 182 and 183:
Public Works DepartmentAdministrati
- Page 184 and 185:
GENERAL FUNDExpendituresPublic Work
- Page 186 and 187:
GENERAL FUNDExpendituresPublic Work
- Page 188 and 189:
Public Works DepartmentEngineering
- Page 190 and 191:
Public Works DepartmentInspection D
- Page 192 and 193:
GENERAL FUNDExpendituresPublic Work
- Page 194 and 195:
GENERAL FUNDExpendituresPublic Work
- Page 196 and 197:
Environmental Services DepartmentAl
- Page 198 and 199:
GENERAL FUNDExpendituresEnvironment
- Page 200 and 201:
Environmental Services DepartmentRe
- Page 202 and 203:
GENERAL FUNDExpendituresEnvironment
- Page 204 and 205:
GENERAL FUNDExpendituresEnvironment
- Page 206 and 207:
Environmental Services DepartmentAn
- Page 208 and 209:
Environmental Services DepartmentRi
- Page 210 and 211:
GENERAL FUNDExpendituresEnvironment
- Page 212 and 213:
GENERAL FUNDExpendituresEnvironment
- Page 214 and 215:
Auburn City LibraryMargie B. Huffma
- Page 216 and 217:
LibraryBudget SummaryBiennial Budge
- Page 218 and 219:
GENERAL FUNDExpendituresLibrary (co
- Page 220 and 221:
Parks and Recreation DepartmentRebe
- Page 222 and 223:
GENERAL FUNDExpendituresParks and R
- Page 224 and 225: Parks and Recreation DepartmentLeis
- Page 226 and 227: Parks and Recreation DepartmentPark
- Page 228 and 229: GENERAL FUNDExpendituresParks and R
- Page 230 and 231: Planning DepartmentRobert J. Juster
- Page 232 and 233: GENERAL FUNDExpendituresPlanningCla
- Page 234 and 235: Non-DepartmentalBudget SummaryBienn
- Page 236 and 237: GENERAL FUNDExpendituresNon Departm
- Page 238 and 239: GENERAL FUNDExpendituresNon Departm
- Page 240 and 241: GENERAL FUNDExpendituresNon Departm
- Page 242 and 243: Water and Sewer DepartmentRex Griff
- Page 244 and 245: City of AuburnOverview of Sewer Fun
- Page 246 and 247: SEWER FUNDExpendituresSewer Mainten
- Page 248 and 249: Sewer FundSewer General Operations
- Page 250 and 251: SEWER CAPITALPROJECTS FUNDExpenditu
- Page 252 and 253: City of AuburnDescription of and Tr
- Page 254 and 255: City of AuburnTotal Special Revenue
- Page 256 and 257: City of AuburnCity Gas Tax Special
- Page 258 and 259: City of AuburnState Nine Cent Gas T
- Page 260 and 261: City of AuburnSpecial Additional Sc
- Page 262 and 263: City of AuburnCommunity Development
- Page 264 and 265: City of AuburnDescription of and Tr
- Page 266 and 267: City of AuburnTotal Debt Service Fu
- Page 268 and 269: City of AuburnSpecial Five Mill Tax
- Page 270 and 271: City of AuburnFY 03 & FY 04Biennial
- Page 272 and 273: City of AuburnOverview of Total Ent
- Page 276 and 277: City of AuburnSewer Equipment Repla
- Page 278 and 279: City of AuburnIndustrial Park FundC
- Page 280 and 281: City of AuburnDescription of and Tr
- Page 282 and 283: City of AuburnTotal Internal Servic
- Page 284 and 285: City of AuburnLiability Risk Retent