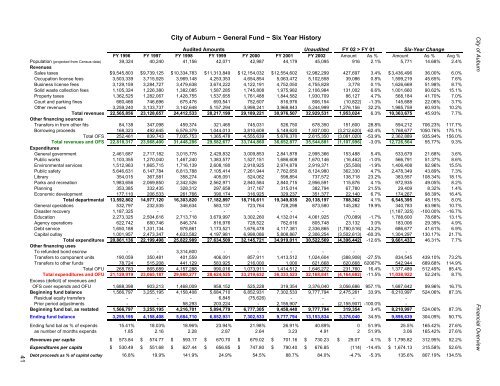
41<strong>City</strong> <strong>of</strong> <strong>Auburn</strong> ~ General Fund ~ Six Year HistoryAudited AmountsUnaudited FY 02 > FY 01Six-Year ChangeFY 1996 FY 1997 FY 1998 FY 1999 FY 2000 FY 2001 FY 2002 Amount As % Amount As % Avg %Population (projected from Census data) 39,324 40,240 41,156 42,071 42,987 44,179 45,095 916 2.1% 5,771 14.68% 2.4%RevenuesSales taxes $ 9,545,803 $ 9,739,125 $ 10,334,783 $ 11,313,849 $ 12,154,032 $ 12,554,602 12,982,299 427,697 3.4% $ 3,436,496 36.00% 6.0%Occupation license fees 3,503,339 3,715,925 3,969,148 4,253,353 4,654,854 5,063,472 5,102,558 39,086 0.8% 1,599,219 45.65% 7.6%Business license fees 3,129,159 3,284,727 3,479,638 3,674,222 4,122,191 4,752,050 4,755,828 3,778 0.1% 1,626,669 51.98% 8.7%Solid waste collection fees 1,105,324 1,226,380 1,382,085 1,587,285 1,745,808 1,975,982 2,106,984 131,002 6.6% 1,001,660 90.62% 15.1%Property taxes 1,362,525 1,282,067 1,428,755 1,537,655 1,761,488 1,844,582 1,930,709 86,127 4.7% 568,184 41.70% 7.0%Court and parking fines 660,466 746,696 675,476 693,541 752,607 816,976 806,154 (10,822) -1.3% 145,688 22.06% 3.7%Other revenues 3,259,240 3,133,737 3,142,648 5,157,294 3,998,241 3,968,843 5,244,999 1,276,156 32.2% 1,985,759 60.93% 10.2%Total revenues 22,565,856 23,128,657 24,412,533 28,217,199 29,189,221 30,976,507 32,929,531 1,953,024 6.3% 10,363,675 45.93% 7.7%Other financing sources -Transfers in from other fds 84,138 347,098 459,374 321,465 745,031 526,750 678,350 151,600 28.8% 594,212 706.23% 117.7%Borrowing proceeds 168,323 492,645 6,576,379 1,044,013 3,810,608 5,149,620 1,937,000 (3,212,620) -62.4% 1,768,677 1050.76% 175.1%Total OFS 252,461 839,743 7,035,753 1,365,478 4,555,639 5,676,370 2,615,350 (3,061,020) -53.9% 2,362,889 935.94% 156.0%Total revenues and OFS 22,818,317 23,968,400 31,448,286 29,582,677 33,744,860 36,652,877 35,544,881 (1,107,996) -3.0% 12,726,564 55.77% 9.3%ExpendituresGeneral government 2,461,687 2,717,182 3,015,775 2,429,832 3,009,853 2,841,878 2,995,366 153,488 5.4% 533,679 21.68% 3.6%Public works 1,103,355 1,270,040 1,467,240 1,383,577 1,527,151 1,686,608 1,670,146 (16,462) -1.0% 566,791 51.37% 8.6%Environmental services 1,512,963 1,865,715 1,716,139 2,608,180 2,918,925 2,974,879 2,919,371 (55,508) -1.9% 1,406,408 92.96% 15.5%Public safety 5,646,631 6,147,784 6,813,788 7,105,414 7,261,944 7,762,650 8,124,980 362,330 4.7% 2,478,349 43.89% 7.3%Library 354,015 367,581 358,274 405,091 524,062 598,854 737,572 138,718 23.2% 383,557 108.34% 18.1%Parks and recreation 1,983,656 2,069,850 2,342,526 2,562,971 2,840,584 2,840,715 2,956,591 115,876 4.1% 972,935 49.05% 8.2%Planning 353,385 332,435 328,312 297,658 317,167 315,014 382,794 67,780 21.5% 29,409 8.32% 1.4%Economic development 177,110 206,533 261,766 390,174 316,925 329,237 351,377 22,140 6.7% 174,267 98.39% 16.4%Total departmental 13,592,802 14,977,120 16,303,820 17,182,897 18,716,611 19,349,835 20,138,197 788,362 4.1% 6,545,395 48.15% 8.0%General operations 532,797 232,535 346,634 583,137 723,764 728,298 873,580 145,282 19.9% 340,783 63.96% 10.7%Disaster recovery 1,187,325 - - - - - - - (1,187,325) -100.00% -16.7%Education 2,273,325 2,504,616 2,713,718 3,679,997 3,302,260 4,132,014 4,061,925 (70,089) -1.7% 1,788,600 78.68% 13.1%Agency operations 622,742 680,746 846,374 816,976 728,522 782,616 805,748 23,132 3.0% 183,006 29.39% 4.9%Debt service 1,650,188 1,331,134 978,861 1,173,521 1,676,478 4,117,381 2,336,865 (1,780,516) -43.2% 686,677 41.61% 6.9%Capital outlay 1,001,957 2,473,347 4,633,582 4,197,981 6,998,086 5,808,867 2,306,254 (3,502,613) -60.3% 1,304,297 130.17% 21.7%Total expenditures 20,861,136 22,199,498 25,822,989 27,634,509 32,145,721 34,919,011 30,522,569 (4,396,442) -12.6% 9,661,433 46.31% 7.7%Other financing usesTo refunded bond escrow - - 3,314,600 - - - - - -Transfers to component units 190,059 350,481 401,559 406,091 857,911 1,413,512 1,024,604 (388,908) -27.5% 834,545 439.10% 73.2%Transfers to other funds 78,724 515,208 441,129 583,925 216,000 1,000 621,668 620,668 62067% 542,944 689.68% 114.9%Total OFU 268,783 865,689 4,157,288 990,016 1,073,911 1,414,512 1,646,272 231,760 16.4% 1,377,489 512.49% 85.4%Total expenditures and OFU 21,129,919 23,065,187 29,980,277 28,624,525 33,219,632 36,333,523 32,168,841 (4,164,682) -11.5% 11,038,922 52.24% 8.7%Excess (deficit) <strong>of</strong> revenues andOFS over expends and OFU 1,688,398 903,213 1,468,009 958,152 525,228 319,354 3,376,040 3,056,686 957.1% 1,687,642 99.96% 16.7%Beginning fund balance 1,566,797 3,255,195 4,158,408 5,684,710 6,852,931 7,302,533 9,777,794 2,475,261 33.9% 8,210,997 524.06% 87.3%Residual equity transfers - - - 6,845 (75,626) - - - -Prior period adjustments - - 58,293 203,224 - 2,155,907 - (2,155,907) -100.0% -Beginning fund bal, as restated 1,566,797 3,255,195 4,216,701 5,894,779 6,777,305 9,458,440 9,777,794 319,354 3.4% 8,210,997 524.06% 87.3%Ending fund balance 3,255,195 4,158,408 5,684,710 6,852,931 7,302,533 9,777,794 13,153,834 3,376,040 34.5% 9,898,639 304.09% 50.7%Ending fund bal as % <strong>of</strong> expends 15.41% 18.03% 18.96% 23.94% 21.98% 26.91% 40.89% 0 51.9% 25.5% 165.42% 27.6%as number <strong>of</strong> months expends 1.85 2.16 2.28 2.87 2.64 3.23 4.91 2 51.9% 3.06 165.42% 27.6%Revenues per capita$ 573.84 $ 574.77 $ 593.17 $ 670.70 $ 679.02 $ 701.16 $ 730.23 $ 29.07 4.1% $ 1,795.82 312.95% 52.2%Expenditures per capita $ 530.49 $ 551.68 $ 627.44 $ 656.85 $ 747.80 $ 790.40 $ 676.85 (114) -14.4% $ 1,674.13 315.58% 52.6%Debt proceeds as % <strong>of</strong> capital outlay 16.8% 19.9% 141.9% 24.9% 54.5% 88.7% 84.0% -4.7% -5.3% 135.6% 807.19% 134.5%<strong>City</strong> <strong>of</strong> <strong>Auburn</strong> Financial Overview
Amounts shown in this projection are for illustrative purposes only.Projec- Histor-FY 2001 FY 2002 FY 2003 FY 2004 FY 2005 FY 2006 FY 2007 FY 2008 FY 2009 FY 2010 FY 2011 tion ical(audited) unaudited actual % %Population (projected from Census data) 44,179 45,270 46,388 47,534 48,708 49,911 51,144 52,407 53,702 55,028 56,388RevenuesSales taxes 12,554,602 13,000,000 13,650,000 14,332,500 14,905,800 15,502,032 16,122,113 16,766,998 17,437,678 18,135,185 18,860,592 4.00% 6.3%Occupation license fees 5,063,472 5,100,000 5,304,000 5,516,160 5,764,387 6,023,785 6,294,855 6,578,123 6,874,139 7,183,475 7,506,732 4.50% 8.9%Business license fees 4,752,050 4,678,066 4,911,969 5,157,568 5,415,446 5,686,218 5,970,529 6,269,056 6,582,509 6,911,634 7,257,216 5.00% 10.4%Solid waste collection fees 1,975,982 2,101,343 2,258,944 2,428,365 2,622,634 2,832,444 3,059,040 3,303,763 3,568,064 3,853,509 4,161,790 8.00% 15.8%Property taxes 1,844,582 1,906,435 1,973,160 2,042,221 2,113,699 2,187,678 2,264,247 2,343,495 2,425,518 2,510,411 2,598,275 3.50% 7.1%Court and parking fines 816,976 783,058 798,719 814,694 830,987 847,607 864,559 881,850 899,488 917,477 935,827 2.00% 4.7%Other revenues 3,968,843 4,421,787 4,510,223 4,600,427 4,692,436 4,786,284 4,882,010 4,979,650 5,079,243 5,180,828 5,284,445 2.00% 4.4%Total revenues 30,976,507 31,990,689 33,407,015 34,891,934 36,345,389 37,866,049 39,457,354 41,122,936 42,866,638 44,692,520 46,604,876Other financing sourcesTransfers in from other fds 526,750 853,750 1,914,098 1,003,771 532,018 537,338 542,711 548,138 553,620 559,156 564,747 1.00% 105.2%Borrowing proceeds 5,149,620 1,937,000 3,475,579 1,283,198 591.9%Total OFS 5,676,370 2,790,750 5,389,677 2,286,969 532,018 537,338 542,711 548,138 553,620 559,156 564,747Total revenues and OFS 36,652,877 34,781,439 38,796,692 37,178,903 36,877,406 38,403,387 40,000,065 41,671,075 43,420,258 45,251,675 47,169,624ExpendituresGeneral government 2,841,878 3,135,844 3,746,104 3,936,928 4,055,036 4,176,687 4,301,988 4,431,047 4,563,979 4,700,898 4,841,925 3.00% 3.1%Public works 1,686,608 1,742,260 2,087,969 2,141,458 2,205,702 2,271,873 2,340,029 2,410,230 2,482,537 2,557,013 2,633,723 3.00% 10.6%Environmental services 2,974,879 3,102,235 2,855,818 2,962,494 3,051,369 3,142,910 3,237,197 3,334,313 3,434,342 3,537,373 3,643,494 3.00% 19.3%Public safety 7,762,650 8,084,113 8,572,062 8,826,973 9,091,782 9,364,536 9,645,472 9,934,836 10,232,881 10,539,867 10,856,063 3.00% 7.5%Library 598,854 743,288 858,659 884,749 911,291 938,630 966,789 995,793 1,025,667 1,056,437 1,088,130 3.00% 13.8%Parks and recreation 2,840,715 3,028,791 3,227,849 3,539,563 3,645,750 3,755,122 3,867,776 3,983,809 4,103,324 4,226,423 4,353,216 3.00% 8.6%Planning 315,014 368,005 392,903 390,182 401,887 413,944 426,362 439,153 452,328 465,898 479,875 3.00% -2.2%Economic development 329,237 337,406 381,657 398,532 410,488 422,803 435,487 448,551 462,008 475,868 490,144 3.00% 17.2%Total departmental 19,349,835 20,541,942 22,123,021 23,080,879 23,773,305 24,486,505 25,221,100 25,977,733 26,757,065 27,559,777 28,386,570General operations 728,298 975,337 1,230,400 1,059,493 1,112,468 1,168,091 1,226,496 1,287,820 1,352,211 1,419,822 1,490,813 5.00% 7.3%Education 4,132,014 4,061,925 4,110,444 4,357,070 4,705,636 5,082,086 5,488,653 5,927,746 6,401,965 6,914,123 7,467,252 8.00% 16.4%Agency operations 782,616 796,605 750,868 750,868 789,162 829,410 871,709 916,167 962,891 1,011,999 1,063,610 5.00% 5.1%Debt service 4,117,381 3,037,268 2,880,423 2,879,200 2,581,773 2,729,571 2,388,342 1,944,977 1,340,882 1,175,708 754,149 * 29.9%Capital outlay 5,808,867 2,934,979 5,196,154 3,458,610 3,631,541 3,813,118 4,003,773 4,203,962 4,414,160 4,634,868 4,866,612 5.00% 96.0%Total expenditures 34,919,011 32,348,056 36,291,310 35,586,120 36,593,884 38,108,781 39,200,073 40,258,405 41,229,174 42,716,296 44,029,006Other financing usesTransfers to component units 1,413,512 710,000 1,247,664 1,260,861 1,137,861 1,430,913 1,143,511 1,165,159 1,185,760 1,963,762 1,092,602 * 128.7%Transfers to other funds 1,000 559,473 378,100 391,600 317,196 256,929 208,112 168,571 136,542 110,599 89,586 -19.0% -19.7%Total OFU 1,414,512 1,269,473 1,625,764 1,652,461 1,455,057 1,687,842 1,351,623 1,333,730 1,322,302 2,074,361 1,182,188Total expenditures and OFU 36,333,523 33,617,529 37,917,074 37,238,581 38,048,941 39,796,623 40,551,696 41,592,135 42,551,476 44,790,657 45,211,194Excess (deficit) <strong>of</strong> revenues andOFS over expends and OFU 319,354 1,163,910 879,618 (59,678) (1,171,535) (1,393,236) (551,631) 78,940 868,781 461,018 1,958,430Beginning fund balance 7,302,533 9,777,794 10,941,704 11,821,322 11,761,644 10,590,109 9,196,873 8,645,242 8,724,182 9,592,963 10,053,981Prior period adjustments 2,155,907 - - - - - - - - - -Beginning fund balance,as restated 9,458,440 9,777,794 10,941,704 11,821,322 11,761,644 10,590,109 9,196,873 8,645,242 8,724,182 9,592,963 10,053,981Ending fund balance 9,777,794 10,941,704 11,821,322 11,761,644 10,590,109 9,196,873 8,645,242 8,724,182 9,592,963 10,053,981 12,012,411Ending fund bal as % <strong>of</strong> expends 26.91% 32.55% 31.18% 31.58% 27.83% 23.11% 21.32% 20.98% 22.54% 22.45% 26.57%as number <strong>of</strong> months expends 3.23 3.91 3.74 3.79 3.34 2.77 2.56 2.52 2.71 2.69 3.19Cumulative impact on fund balance ~ FY 2003 - FY 2011: 1,070,707Revenues per capita $ 701.16 $ 706.66 $ 720.16 $ 734.04 $ 746.18 $ 758.67 $ 771.49 $ 784.68 $ 798.23 $ 812.17 $ 826.51Expenditures per capita $ 790.40 $ 714.55 $ 782.34 $ 748.64 $ 751.29 $ 763.53 $ 766.46 $ 768.18 $ 767.74 $ 776.26 $ 780.83* Some future expenditure requirements are based on legally established amounts.<strong>City</strong> <strong>of</strong> <strong>Auburn</strong> ~ General Fund Ten-Year Projection<strong>City</strong> <strong>of</strong> <strong>Auburn</strong> Financial Overview42
- Page 1: TheCity of AuburnAlabamaBiennial Bu
- Page 4 and 5: City of Auburn General Fund (contin
- Page 6 and 7: City of AuburnFY 03 & FY 04Biennial
- Page 8 and 9: City of Auburn, AlabamaApproximatel
- Page 10 and 11: City of Auburn, Alabamaachievements
- Page 14 and 15: City of Auburn, Alabama• The annu
- Page 16 and 17: Miscellaneous Statistical DataAubur
- Page 18 and 19: City of AuburnPersonnel Summary by
- Page 20 and 21: City of AuburnFY03 & FY04Biennial B
- Page 22 and 23: City of AuburnFY03 & FY04Biennial B
- Page 24 and 25: City of AuburnFY03 & FY04Biennial B
- Page 26 and 27: The Government Finance Officers Ass
- Page 28 and 29: Budget Message (continued) May 28,
- Page 30 and 31: Budget Message (continued) May 28,
- Page 32 and 33: Budget Message (continued) May 28,
- Page 34 and 35: Budget Message (continued) May 28,
- Page 36 and 37: Budget Message (continued) May 28,
- Page 38 and 39: Budget Message (continued) May 28,
- Page 40 and 41: Budget Message (continued) May 28,
- Page 42 and 43: City of Auburn Key Decisions of the
- Page 44 and 45: City of AuburnFinancial OverviewThe
- Page 46 and 47: City of AuburnFinancial Overview$40
- Page 50 and 51: The City of AuburnDescription of th
- Page 52 and 53: City of Auburnexpenditures by fund
- Page 54 and 55: City of AuburnBiennial Budget Calen
- Page 56 and 57: City of AuburnAnnual Citizen Survey
- Page 58 and 59: City of AuburnAmong the following s
- Page 60 and 61: Auburn 202022 Goals for 2020The Aub
- Page 62 and 63: City of AuburnRevenue Overview• a
- Page 64 and 65: City of AuburnRevenue Overviewincre
- Page 66 and 67: City of AuburnRevenue OverviewCity
- Page 68 and 69: City of AuburnOverview of Debt Poli
- Page 70 and 71: City of AuburnOverview of Debt Poli
- Page 72 and 73: City of AuburnOverview of Debt Poli
- Page 74 and 75: City of AuburnOverview of Debt Poli
- Page 76 and 77: City of AuburnOverview of Projected
- Page 78 and 79: City of AuburnDetails of Financing
- Page 80 and 81: PublicTotal-AllSpecial Safety Budge
- Page 82 and 83: City of AuburnOverview of Other Fun
- Page 84 and 85: City of AuburnSummary of Capital Ou
- Page 86 and 87: City of AuburnSummary of Capital Ou
- Page 88 and 89: City of AuburnSummary of Capital Ou
- Page 90 and 91: City of AuburnSummary of Capital Ou
- Page 92 and 93: City of AuburnSummary of Capital Ou
- Page 94 and 95: City of AuburnCapital Improvements
- Page 96 and 97: City of AuburnCapital Improvements
- Page 98 and 99:
City of AuburnFY 03 & FY 04Biennial
- Page 100 and 101:
City of AuburnTrends in Total Reven
- Page 102 and 103:
The City of AuburnGeneral Fund - Su
- Page 104 and 105:
City of AuburnGeneral Fund - Detail
- Page 106 and 107:
City of AuburnGeneral Fund - Detail
- Page 108 and 109:
City of AuburnOverview of Expenditu
- Page 110 and 111:
City of AuburnDetail of Expenditure
- Page 112 and 113:
City of AuburnDetails of Expenditur
- Page 114 and 115:
City of AuburnSummary of Expenditur
- Page 116 and 117:
City of AuburnGeneral Fund - Summar
- Page 118 and 119:
City of AuburnComparative Budgeted
- Page 120 and 121:
City of AuburnBiennial BudgetTable
- Page 122 and 123:
City of AuburnOverview of Expenditu
- Page 124 and 125:
City CouncilBudget SummaryBiennial
- Page 126 and 127:
Office of the City ManagerDouglas J
- Page 128 and 129:
Office of the City ManagerBudget Su
- Page 130 and 131:
GENERAL FUNDExpendituresCity Manage
- Page 132 and 133:
Judicial DepartmentJoe Bailey, Muni
- Page 134 and 135:
GENERAL FUNDExpendituresJudicialCla
- Page 136 and 137:
Information Technology DepartmentJa
- Page 138 and 139:
Information TechnologyBudget Summar
- Page 140 and 141:
GENERAL FUNDExpendituresInformation
- Page 142 and 143:
GENERAL FUNDExpendituresInformation
- Page 144 and 145:
Finance DepartmentAndrea E. Jackson
- Page 146 and 147:
Finance DepartmentAndrea Jackson, D
- Page 148 and 149:
GENERAL FUNDExpendituresFinanceClas
- Page 150 and 151:
Economic DevelopmentDepartmentPhill
- Page 152 and 153:
Economic Development DepartmentPhil
- Page 154 and 155:
GENERAL FUNDExpendituresEconomic De
- Page 156 and 157:
Human Resources DepartmentSteven A.
- Page 158 and 159:
Human Resources DepartmentHuman Res
- Page 160 and 161:
GENERAL FUNDExpendituresHuman Resou
- Page 162 and 163:
GENERAL FUNDExpendituresHuman Resou
- Page 164 and 165:
City of Auburn Public Safety Depart
- Page 166 and 167:
Public Safety Department Mission an
- Page 168 and 169:
GENERAL FUNDExpendituresPublic Safe
- Page 170 and 171:
Public Safety DepartmentPolice Divi
- Page 172 and 173:
GENERAL FUNDExpendituresPublic Safe
- Page 174 and 175:
GENERAL FUNDExpendituresPublic Safe
- Page 176 and 177:
Public Safety DepartmentCommunicati
- Page 178 and 179:
Public Safety DepartmentCodes Enfor
- Page 180 and 181:
Public Works DepartmentJeff Ramsey,
- Page 182 and 183:
Public Works DepartmentAdministrati
- Page 184 and 185:
GENERAL FUNDExpendituresPublic Work
- Page 186 and 187:
GENERAL FUNDExpendituresPublic Work
- Page 188 and 189:
Public Works DepartmentEngineering
- Page 190 and 191:
Public Works DepartmentInspection D
- Page 192 and 193:
GENERAL FUNDExpendituresPublic Work
- Page 194 and 195:
GENERAL FUNDExpendituresPublic Work
- Page 196 and 197:
Environmental Services DepartmentAl
- Page 198 and 199:
GENERAL FUNDExpendituresEnvironment
- Page 200 and 201:
Environmental Services DepartmentRe
- Page 202 and 203:
GENERAL FUNDExpendituresEnvironment
- Page 204 and 205:
GENERAL FUNDExpendituresEnvironment
- Page 206 and 207:
Environmental Services DepartmentAn
- Page 208 and 209:
Environmental Services DepartmentRi
- Page 210 and 211:
GENERAL FUNDExpendituresEnvironment
- Page 212 and 213:
GENERAL FUNDExpendituresEnvironment
- Page 214 and 215:
Auburn City LibraryMargie B. Huffma
- Page 216 and 217:
LibraryBudget SummaryBiennial Budge
- Page 218 and 219:
GENERAL FUNDExpendituresLibrary (co
- Page 220 and 221:
Parks and Recreation DepartmentRebe
- Page 222 and 223:
GENERAL FUNDExpendituresParks and R
- Page 224 and 225:
Parks and Recreation DepartmentLeis
- Page 226 and 227:
Parks and Recreation DepartmentPark
- Page 228 and 229:
GENERAL FUNDExpendituresParks and R
- Page 230 and 231:
Planning DepartmentRobert J. Juster
- Page 232 and 233:
GENERAL FUNDExpendituresPlanningCla
- Page 234 and 235:
Non-DepartmentalBudget SummaryBienn
- Page 236 and 237:
GENERAL FUNDExpendituresNon Departm
- Page 238 and 239:
GENERAL FUNDExpendituresNon Departm
- Page 240 and 241:
GENERAL FUNDExpendituresNon Departm
- Page 242 and 243:
Water and Sewer DepartmentRex Griff
- Page 244 and 245:
City of AuburnOverview of Sewer Fun
- Page 246 and 247:
SEWER FUNDExpendituresSewer Mainten
- Page 248 and 249:
Sewer FundSewer General Operations
- Page 250 and 251:
SEWER CAPITALPROJECTS FUNDExpenditu
- Page 252 and 253:
City of AuburnDescription of and Tr
- Page 254 and 255:
City of AuburnTotal Special Revenue
- Page 256 and 257:
City of AuburnCity Gas Tax Special
- Page 258 and 259:
City of AuburnState Nine Cent Gas T
- Page 260 and 261:
City of AuburnSpecial Additional Sc
- Page 262 and 263:
City of AuburnCommunity Development
- Page 264 and 265:
City of AuburnDescription of and Tr
- Page 266 and 267:
City of AuburnTotal Debt Service Fu
- Page 268 and 269:
City of AuburnSpecial Five Mill Tax
- Page 270 and 271:
City of AuburnFY 03 & FY 04Biennial
- Page 272 and 273:
City of AuburnOverview of Total Ent
- Page 274 and 275:
City of AuburnDetail of Enterprise
- Page 276 and 277:
City of AuburnSewer Equipment Repla
- Page 278 and 279:
City of AuburnIndustrial Park FundC
- Page 280 and 281:
City of AuburnDescription of and Tr
- Page 282 and 283:
City of AuburnTotal Internal Servic
- Page 284 and 285:
City of AuburnLiability Risk Retent