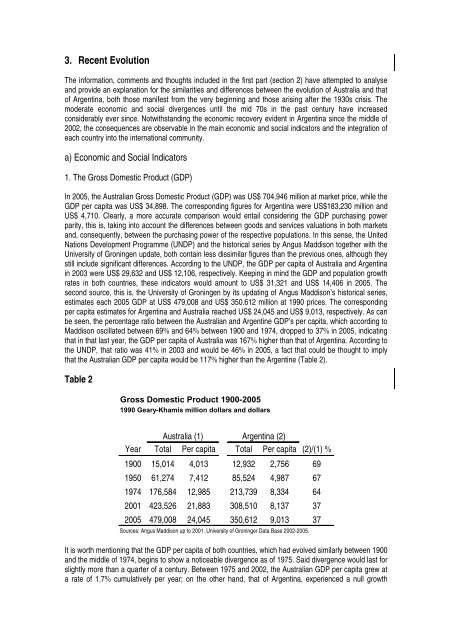
3. Recent EvolutionThe information, comments and thoughts inclu<strong>de</strong>d in the first part (section 2) have attempted to analyseand provi<strong>de</strong> an explanation for the similarities and differences between the evolution of Australia and thatof Argentina, both those manifest from the very beginning and those arising after the 1930s crisis. Themo<strong>de</strong>rate economic and social divergences until the mid 70s in the past century have increasedconsi<strong>de</strong>rably ever since. Notwithstanding the economic recovery evi<strong>de</strong>nt in Argentina since the middle of2002, the consequences are observable in the main economic and social indicators and the integration ofeach country into the international community.a) Economic and Social Indicators1. The Gross Domestic Product (GDP)In 2005, the Australian Gross Domestic Product (GDP) was US$ 704,946 million at market price, while theGDP per capita was US$ 34,898. The corresponding figures for Argentina were US$183,230 million andUS$ 4,710. Clearly, a more accurate comparison would entail consi<strong>de</strong>ring the GDP purchasing powerparity, this is, taking into account the differences between goods and services valuations in both marketsand, consequently, between the purchasing power of the respective populations. In this sense, the UnitedNations Development Programme (UNDP) and the historical series by Angus Maddison together with theUniversity of Groningen update, both contain less dissimilar figures than the previous ones, although theystill inclu<strong>de</strong> significant differences. According to the UNDP, the GDP per capita of Australia and Argentinain 2003 were US$ 29,632 and US$ 12,106, respectively. Keeping in mind the GDP and population growthrates in both countries, these indicators would amount to US$ 31,321 and US$ 14,406 in 2005. Thesecond source, this is, the University of Groningen by its updating of Angus Maddison’s historical series,estimates each 2005 GDP at US$ 479,008 and US$ 350.612 million at 1990 prices. The correspondingper capita estimates for Argentina and Australia reached US$ 24,045 and US$ 9,013, respectively. As canbe seen, the percentage ratio between the Australian and Argentine GDP’s per capita, which according toMaddison oscillated between 69% and 64% between 1900 and 1974, dropped to 37% in 2005, indicatingthat in that last year, the GDP per capita of Australia was 167% higher than that of Argentina. According tothe UNDP, that ratio was 41% in 2003 and would be 46% in 2005, a fact that could be thought to implythat the Australian GDP per capita would be 117% higher than the Argentine (Table 2).Table 2Gross Domestic Product 1900-20051990 Geary-Khamis million dollars and dollarsAustralia (1) Argentina (2)Year Total Per capita Total Per capita (2)/(1) %1900 15,014 4,013 12,932 2,756 691950 61,274 7,412 85,524 4,987 671974 176,584 12,985 213,739 8,334 642001 423,526 21,883 308,510 8,137 372005 479,008 24,045 350,612 9,013 37Sources: Angus Maddison up to 2001. University of Groninger Data Base 2002-2005.It is worth mentioning that the GDP per capita of both countries, which had evolved similarly between 1900and the middle of 1974, begins to show a noticeable divergence as of 1975. Said divergence would last forslightly more than a quarter of a century. Between 1975 and 2002, the Australian GDP per capita grew ata rate of 1.7% cumulatively per year; on the other hand, that of Argentina, experienced a null growth
during the same period. As of 2003, this situation changes due to a major economic policy change inArgentina. Whereas in Australia the GDP per capita grew at a cumulative 2.4% per year from 2002 to2005, which means that it did so according to the trend of the last ten years, the Argentine GDP per capitagrew at 2.6% (Table 3). The last estimates for 2006 forecast a lower rate of growth for Australia, around1% of GDP per capita, and a rate of growth similar to the 2003-2005 annual average for Argentina at 7.6%of GDP per capita.The short period of four years corresponding to the latter evolution does not enable us to infer from thefigures whether it represents a reversal of the divergent growth trend observed throughout the past thirtyyears. Nevertheless, some important elements reinforce the assumption that Argentina may be looking ata new stage of its long-term growth. The change in relative prices as a result of the 2002 <strong>de</strong>valuation andthe subsequent exchange rate stabilisation, within a low inflation context, favoured by a strong fiscaldiscipline and the adjustment of money supply to its <strong>de</strong>mand, has brought about a macroeconomicsituation that had not been seen in a very long time. Export growth triggered by the change in relativeprices and the higher competitiveness of domestic production vis á vis imports, drove up production,together with an increase in employment and tax revenues. The latter enabled a significant leap in publicinvestment, complementary to the increase in private investment, stimulated by the expansion of exportsand consumption. The restructuring of the foreign <strong>de</strong>bt and its reduction as compared to GDP representanother factor contributing to freeing up resources for investment, expenditures in education and inscience and technology, and meeting social needs.Table 3GDP per capita Growth RatespercentagesYear Australia Argentina1870-1913 0.9 1.91914-1950 0.7 0.71951-1974 2.4 2.11975-2001 1.7 0.02002-2005 2.4 2.6Sources: Angus Maddison up to 2001. University of Groninger Data Base 2002-2005.The estimates for 2006 are rates of growth of GDP of 8.5% and 2% for Argentina and Australia,respectively. This <strong>de</strong>velopment for the fourth consecutive year in the case of Argentina represents thehighest economic growth in the past 100 years, projecting positive expectations in the general populationand the business sector and, therefore, encouraging the investment process.2. The fiscal positionIn 2005, the Australian government tax revenue level stood at US$ 161,000 million as compared to US$29,311 million in Argentina. The relative difference in terms of fe<strong>de</strong>ral tax collection 2 with respect to GDP(22.9% and 16.0%, respectively) indicates that, in the case of Argentina, even with a lower GDP percapita, there is a significant margin for greater collection efficiency, so as to generate additional resourcesfor investment in infrastructure and human resources (education and health care), including investment in2 Excluding the states in the case of Australia and provinces in that of Argentina.
- Page 1 and 2:
Revista del CEIComercio Exterior e
- Page 3:
SUMARIOCOYUNTURA COMERCIALEstructur
- Page 7 and 8:
PresentaciónLa sección de coyuntu
- Page 13 and 14:
G r á f i c o 3Diversificación de
- Page 15 and 16:
Las exportaciones de productos prim
- Page 17 and 18:
Relacionado con la evolución que v
- Page 19 and 20:
Vinculado al fuerte crecimiento que
- Page 21 and 22:
Este efecto fue revertido principal
- Page 23 and 24:
Aun así, merecen destacarse al men
- Page 25 and 26:
Cuadro A 1Evolución del saldo de b
- Page 28 and 29:
Cuadro A 4Exportaciones e índice d
- Page 30 and 31:
Cuadro A 6Saldo de balanza comercia
- Page 32 and 33:
las exportaciones en concepto de vi
- Page 34 and 35:
G r á f i c o 3Valor y cambio abso
- Page 36 and 37:
como lo son Egipto, Nigeria, Venezu
- Page 38 and 39:
G r á f i c o 2Crecimiento de las
- Page 40 and 41:
El total exportado también se encu
- Page 42 and 43:
Del Cuadro 1 se desprende una asoci
- Page 44 and 45:
En el primer semestre del año, el
- Page 46 and 47:
Vehículos de navegación aérea, m
- Page 48 and 49:
Unidos. En todos los casos menciona
- Page 50 and 51:
BibliografíaCastagnino, T. (2006).
- Page 52 and 53:
Cuadro A 2G R Á F I C O 1:Exportac
- Page 54 and 55:
Cuadro A 4Exportaciones e índice d
- Page 56 and 57:
Cuadro A 6Saldo de balanza comercia
- Page 58 and 59:
las exportaciones en concepto de vi
- Page 60 and 61:
G r á f i c o 3Valor y cambio abso
- Page 62 and 63:
Se mantiene eldinamismo del BloqueH
- Page 64 and 65:
vez como miembro pleno, en junio tu
- Page 66 and 67:
en el primer semestre del año.Las
- Page 68 and 69:
septiembre del año pasado un baja
- Page 70 and 71:
considera que al cierre del año la
- Page 72 and 73:
dólares norteamericanos, asciende
- Page 74 and 75:
Ambición y equilibrioen la Ronda D
- Page 76 and 77:
3. Resultados mínimos de las conce
- Page 78 and 79:
La aplicación de la propuesta menc
- Page 80 and 81:
4. La ambición y el equilibrio nec
- Page 82 and 83:
El ingreso deVenezuela al Mercosur:
- Page 84 and 85:
A 2006 la estructura arancelaria vi
- Page 86 and 87:
En principio la Argentina participa
- Page 88 and 89:
hubieron otros donde la participaci
- Page 90 and 91:
se puede establecer, según datos d
- Page 92 and 93:
La otra metodología que se utiliza
- Page 94 and 95:
Asimismo, reconoce que la prestaci
- Page 96 and 97:
problema debido a que en el Anexo D
- Page 98 and 99:
Según lo observado en los procesos
- Page 100 and 101:
Trade Facilitation:Definitions, WTO
- Page 102 and 103:
se puede establecer, según datos d
- Page 104 and 105:
La otra metodología que se utiliza
- Page 106 and 107: Asimismo, reconoce que la prestaci
- Page 108 and 109: problema debido a que en el Anexo D
- Page 110 and 111: Según lo observado en los procesos
- Page 112 and 113: Australia - Argentina:convergencias
- Page 114 and 115: Artículosde 2002 en adelante, por
- Page 116 and 117: Artículosaustraliano), para la rat
- Page 118 and 119: Artículosimportantes inversiones y
- Page 120 and 121: Artículossociales de carácter mod
- Page 122 and 123: Artículospagos de la Administraci
- Page 124 and 125: Artículosmayor libertad de acción
- Page 126 and 127: ArtículosLa disminución del peso
- Page 128 and 129: Artículospor 6.490 millones de dó
- Page 130 and 131: ArtículosLos datos anteriores evid
- Page 132 and 133: ArtículosAustralia a Canberra en 1
- Page 134 and 135: Artículossentaron el 25,0% del tot
- Page 136 and 137: ArtículosBibliografíaAustralian B
- Page 138 and 139: El análisis cuantitativo de lapol
- Page 140 and 141: ArtículosSimulacionesLa metodolog
- Page 142 and 143: Artículoscomo así también insumo
- Page 144 and 145: Artículosdiante la matriz inversa
- Page 146 and 147: ArtículosLas estimaciones realizad
- Page 148 and 149: SummaryAustralia - Argentina:Conver
- Page 150 and 151: evealed by growing political and cu
- Page 152 and 153: Governor-General proposing the pers
- Page 154 and 155: enabled a symmetrical growth in the
- Page 158 and 159: science and technology. The last es
- Page 160 and 161: Table 5Employment and Unemploymentp
- Page 162 and 163: Table 7High Human Development Index
- Page 164 and 165: It can be stated that Australia has
- Page 166 and 167: 3. Balance of Payments and Foreign
- Page 168 and 169: end of 2006. For the very first tim
- Page 170 and 171: Budget surplus has a counter-cyclic
- Page 172 and 173: plantations, food industries, cold
- Page 174 and 175: The One Thousand Faces ofAgricultur
- Page 176 and 177: A fines de la década de los 50, cu
- Page 178 and 179: estratégicos que efectúan los pa
- Page 180 and 181: subsidios (es más, sólo el 5 por
- Page 182 and 183: de exportar aeronaves y de no afron
- Page 184 and 185: deberíamos suponer que habría una
- Page 186 and 187: tienen jerarquía de tratado intern
- Page 188 and 189: Con el establecimiento de la OMC se
- Page 190 and 191: 3. Para completar el tercer aspecto
- Page 192 and 193: 5 Anexo
- Page 194 and 195: AnexoPIB a precios y tipos de cambi
- Page 196 and 197: AnexoSaldo de la Cuenta Corrienteen
- Page 198 and 199: AnexoTasas de Desempleopromedio anu
- Page 200 and 201: AnexoTasas de inflación (Precios M