Revista del CEI - Centro de EconomÃa Internacional
Revista del CEI - Centro de EconomÃa Internacional
Revista del CEI - Centro de EconomÃa Internacional

You also want an ePaper? Increase the reach of your titles
YUMPU automatically turns print PDFs into web optimized ePapers that Google loves.
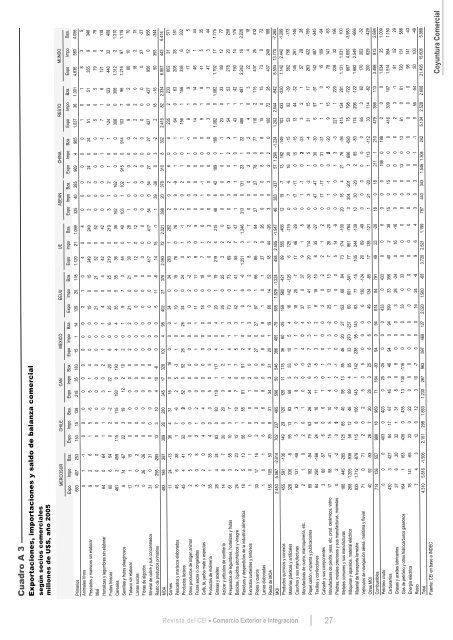
Cuadro A 3Fuente: <strong>CEI</strong> en base a INDECG R Á F I C O 1:Coyuntura ComercialPrimarios 660 407 253 153 15 138 218 35 183 15 1 14 139 20 118 1.120 21 1.099 325 40 285 969 4 965 1.037 36 1.001 4.636 580 4.056Animales Vivos 0 1 -1 0 0 0 0 0 0 0 0 0 2 1 0 4 0 4 0 0 0 0 0 0 1 0 1 8 3 5Pescados y mariscos sin elaborar 9 2 6 1 5 -5 5 1 4 0 0 0 15 0 15 249 0 249 2 0 2 24 0 24 51 0 51 355 9 346Miel 0 0 0 0 0 0 0 0 0 0 0 0 21 0 21 52 0 52 0 0 0 0 0 0 5 0 5 79 0 79Hortalizas y legumbres sin elaborar 64 0 64 1 1 0 3 0 2 1 0 1 4 0 4 42 0 42 0 0 0 0 1 -1 7 1 6 121 4 118Frutas frescas 60 6 54 0 2 -2 1 22 -20 6 0 6 25 0 25 219 0 219 3 1 2 1 0 1 124 0 123 440 32 408Cereales 461 2 459 115 0 115 193 0 193 4 0 4 35 5 35 36 0 36 162 0 162 0 0 0 306 0 306 1.312 2 1.310Semillas y frutos oleaginosos 6 74 -67 22 3 19 12 2 10 2 0 1 9 7 3 44 0 40 103 1 102 915 0 914 103 7 96 1.216 97 1.118Tabaco sin elaborar 17 1 15 0 0 0 0 0 0 2 0 2 21 0 21 30 1 28 1 0 1 0 0 0 9 8 2 80 10 70Lanas sucias 2 0 2 0 0 0 0 0 0 0 0 0 0 0 0 12 0 12 0 0 0 2 0 2 2 2 0 18 2 15Fibras <strong>de</strong> algodón 0 26 -26 0 0 0 0 0 0 0 0 0 0 0 0 0 0 0 0 0 0 0 0 0 0 0 0 0 27 -27Mineral <strong>de</strong> cobre y sus concentrados 31 0 31 0 0 0 0 0 0 0 0 0 0 0 0 417 0 417 54 0 54 27 0 27 427 0 427 956 0 956Resto <strong>de</strong> productos primarios 10 295 -285 13 3 10 4 10 -6 0 0 0 5 11 -6 14 15 -1 1 39 -38 0 3 -2 2 18 -16 50 393 -344MOA 483 185 297 309 28 280 345 17 328 102 4 98 402 27 376 2.093 72 2.021 398 20 378 310 8 302 2.416 82 2.334 6.857 443 6.414Carnes 11 24 -13 36 4 31 16 0 16 0 0 0 34 0 34 263 1 262 2 0 2 6 0 6 235 2 233 602 31 571Pescados y mariscos elaborados 45 6 38 1 7 -6 2 5 -3 1 0 1 19 0 19 76 0 76 0 9 -9 1 0 1 64 0 63 208 28 181Productos lácteos 45 4 41 32 0 32 52 0 52 26 0 26 24 0 24 0 1 -1 2 0 2 1 0 1 156 1 156 338 6 332Otros productos <strong>de</strong> origen animal 2 5 -3 0 0 0 0 0 0 0 0 0 0 2 -2 5 3 2 0 0 0 0 1 -1 9 1 9 17 12 5Frutas secas o congeladas 8 0 8 2 1 2 0 0 0 1 0 1 11 0 11 9 0 9 0 0 0 0 0 0 14 0 14 46 1 44Café, té, yerba mate y especias 2 2 0 4 0 4 0 0 0 0 0 0 18 0 18 7 1 6 0 1 -1 0 0 0 9 1 8 41 5 35Productos <strong>de</strong> molinería 35 1 35 4 0 3 5 0 5 0 0 0 0 0 0 0 2 -2 0 0 0 0 0 0 3 0 3 47 3 44Grasas y aceites 28 4 24 83 0 83 119 1 117 4 0 4 20 1 19 219 4 215 48 6 42 189 0 189 1.082 0 1.082 1.792 17 1.775Azúcar y artículos <strong>de</strong> confitería 14 8 7 20 0 20 3 1 2 1 0 1 25 0 25 2 2 0 0 0 0 0 1 -1 23 0 23 89 12 77Preparados <strong>de</strong> legumbres, hortalizas y frutas 61 3 58 10 3 7 6 4 1 4 1 3 73 0 73 69 2 67 0 3 -3 0 2 -2 54 1 53 278 20 258Bebidas, líquidos alcohólicos y vinagre 24 2 23 12 1 10 7 0 7 5 1 3 42 1 41 55 7 47 1 0 1 1 0 1 43 1 42 190 14 176Residuos y <strong>de</strong>sperdicios <strong>de</strong> la industria alimenticia 18 5 13 56 1 55 91 0 91 2 0 1 0 6 -6 1.251 3 1.248 313 0 131 23 1 22 488 1 487 2.242 16 2.226Extractos curtientes y tintóreos 1 0 1 0 0 0 1 2 0 4 0 3 2 0 2 8 1 7 0 0 0 2 0 2 4 0 3 22 4 18Pieles y cueros 33 17 16 2 3 0 0 0 0 27 0 27 67 1 66 86 2 84 27 0 27 78 0 77 116 2 115 437 25 412Lanas elaboradas 1 0 1 6 0 6 8 0 8 8 0 8 1 0 1 27 0 26 0 0 0 8 0 8 15 0 15 73 0 72Resto <strong>de</strong> MOA 155 105 50 39 8 31 34 3 31 20 1 19 66 14 52 18 44 -26 3 0 3 2 2 0 100 72 28 437 249 188MOI 2.453 5.067 -2.614 702 237 465 596 50 546 386 465 -79 605 1.829 -1.224 458 2.405 -1.947 46 383 -337 57 1.290 -1.234 1.202 2.044 -842 6.504 13.770 -7.265Productos químicos y conexos 455 591 -136 149 29 120 126 11 115 36 60 -25 159 580 -421 89 555 -466 12 19 -7 13 162 -149 103 433 -330 1.142 2.442 -1.299Materias plásticas y artificiales 328 336 -8 95 13 83 58 5 53 10 5 4 16 142 -126 6 125 -119 0 7 -6 16 30 -15 53 92 -39 582 756 -173Cauchos y sus manufacturas 82 131 -49 5 7 -3 8 2 6 1 1 0 18 25 -7 17 46 -29 0 17 -17 0 15 -15 13 44 -32 145 291 -146Manufacturas <strong>de</strong> cuero, marroquinería, etc. 2 1 0 2 0 1 0 0 0 4 0 4 37 0 37 9 1 8 0 1 -1 0 23 -23 3 2 1 57 28 28Papel cartón, imprenta y publicaciones 89 182 -94 79 53 26 24 6 19 7 3 5 11 41 -30 20 114 -94 0 3 -3 1 5 -4 31 15 17 263 422 -159Textiles y confecciones 84 250 -166 24 8 16 11 3 8 3 1 2 6 16 -10 8 35 -27 0 47 -47 0 30 -30 6 97 -91 142 487 -345Calzado y sus componentes 3 60 -57 6 0 6 1 0 1 0 0 0 2 0 2 2 1 2 0 17 -17 0 31 -31 1 1 0 15 109 -94Manufacturas <strong>de</strong> piedra, yeso, etc, prod. cerámicos, vidrio 17 58 -41 15 5 10 4 1 3 1 3 -2 25 13 13 7 26 -20 0 1 -1 0 20 -20 9 15 -5 78 141 -63Piedras, metales preciosos y sus manufacturas, monedas 0 2 -2 0 10 -9 0 2 -1 0 0 0 1 0 0 5 14 -9 0 0 0 1 3 -3 221 1 220 228 32 196Metales comunes y sus manufacturas 180 445 -265 125 85 40 98 13 85 46 20 27 152 68 84 73 174 -100 20 16 4 21 76 -56 415 134 281 1.131 1.031 100Máquinas y aparatos, material eléctrico 268 1.205 -936 58 12 46 89 4 85 33 270 -237 60 601 -541 77 861 -784 3 204 -201 3 696 -693 75 798 -722 667 4.650 -3.983Material <strong>de</strong> transporte terrestre 833 1.712 -879 115 8 106 143 1 142 238 95 143 63 77 -15 105 244 -139 10 30 -20 2 85 -83 174 296 -122 1.682 2.549 -866Vehículos <strong>de</strong> navegación aérea, marítima y fluvial 71 0 71 2 0 2 5 0 5 0 0 0 6 130 -124 20 69 -49 0 0 0 0 0 0 65 3 62 170 202 -32Otras MOI 40 92 -53 26 7 20 28 3 25 6 6 0 49 134 -85 17 138 -121 1 21 -20 1 113 -112 33 114 -82 200 629 -429Combustibles 714 156 557 988 18 969 71 164 -93 94 0 94 874 84 791 49 23 -26 18 0 18 211 1 210 479 366 113 3.498 813 2.684Petróleo crudo 0 0 0 403 0 403 0 25 -25 0 0 0 433 0 433 0 0 0 0 0 0 198 0 198 0 0 0 1.034 25 1.009Carburantes 430 3 427 84 17 67 46 0 46 94 0 94 399 33 356 40 2 38 15 0 15 0 0 0 416 309 107 1.514 364 1.150Grasas y aceites lubricantes 37 6 30 32 1 31 8 0 8 0 0 0 3 26 -24 0 16 -16 0 0 0 0 0 0 2 3 -1 81 52 29Gas <strong>de</strong> petróleo y otros hidrocarburos gaseosos 164 1 163 435 0 435 13 130 -116 0 0 0 33 0 33 0 0 0 0 0 0 13 0 13 61 0 61 720 131 588Energía eléctrica 76 141 -65 22 0 22 0 0 0 0 0 0 0 0 0 0 0 0 0 0 0 0 0 0 0 0 0 98 141 -43Resto 7 4 3 12 0 12 3 10 -7 0 0 0 16 24 -8 9 6 4 3 0 3 0 1 -1 0 55 -54 50 100 -49Total 4.310 5.816 -1.506 2.151 298 1.853 1.230 267 963 597 469 127 2.020 1.960 -60 3.720 2.521 1.199 787 443 343 1.546 1.304 242 5.134 2.528 2.606 21.495 15.606 5.888Expo Impo Bza. Expo Impo Bza. Expo Impo Bza. Expo Impo Bza. Expo Impo Bza. Expo Impo Bza. Expo Impo Bza. Expo Impo Bza. Expo Impo Bza. Expo Impo Bza.MERCOSUR CHILE CAN MEXICO EEUU UE ASEAN CHINARESTO MUNDOExportaciones, importaciones y saldo <strong>de</strong> balanza comercialsegún socios comercialesmillones <strong>de</strong> U$S, año 2005<strong>Revista</strong> <strong><strong>de</strong>l</strong> <strong>CEI</strong>Comercio Exterior e Integración27