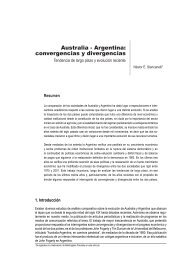
AnexoTasas <strong>de</strong> inflación (Precios Mayoristas)variación anual en porcentajePaíses 2001 2002 2003 2004 2005Alemania 0,1 0,7 1,8 2,9 5,2Argentina -5,4 117,5 2,1 7,7 10,6Australia (*) 3,1 0,2 0,5 4,0 6,0Austria -1,1 0,8 2,5 5,2 1,4Bélgica -1,5 2,6 -0,3 6,2 1,5Bolivia 9,2 0,8 11,2 7,8 7,4Brasil 11,9 35,4 6,3 14,7 -1,0Canadá -6,6 4,8 2,2 6,7 30,5Chile 3,1 10,4 -1,0 8,1 3,2Colombia 6,9 9,3 5,7 4,6 2,1Corea <strong><strong>de</strong>l</strong> Sur -2,5 2,3 3,1 5,3 1,7Dinamarca 0,4 1,3 0,2 2,7 4,6Ecuador -5,6 17,7 4,5 4,3 21,6España -0,9 2,0 1,1 5,0 5,2Estados Unidos -5,9 3,7 5,0 7,6 8,6Filipinas 11,6 7,9 5,8 11,3 8,1Finlandia 1,7 1,6 0,6 0,4 1,0Francia -1,2 0,5 0,1 4,5 2,1Grecia 1,5 1,4 2,0 2,9 0,0India 1,9 3,5 5,9 6,4 5,6Indonesia 8,5 3,9 0,7 10,3 22,6Irlanda -0,3 -2,5 -9,1 -1,6 3,5Italia -1,3 1,5 0,8 4,2 4,2Japón -2,8 -1,3 -0,2 1,8 2,3Malasia -4,5 13,4 3,8 3,4 9,9México 2,6 6,3 6,3 8,0 2,5Nueva Zelandia (*) 6,0 0,2 -0,8 1,7 5,4Países Bajos 1,1 3,5 0,5 4,3 2,6Paraguay 8,6 36,8 9,3 12,7 10,8Perú -2,2 1,7 2,0 4,9 3,6Polonia -0,3 2,3 3,7 5,4 0,2Portugal 2,8 0,4 0,8 2,7 3,1Reino Unido -1,1 1,0 1,8 2,9 2,4Rusia (*) 19,2 10,4 16,4 23,4 20,6Singapur -5,7 4,0 0,8 5,9 11,3Sudáfrica 8,3 12,4 -1,8 1,9 5,1Suecia -0,8 -0,6 -1,9 2,0 6,4Suiza 0,0 -0,5 0,5 1,3 1,1Tailandia 0,9 4,0 2,9 10,1 8,0Turquía 88,6 30,8 13,9 13,8 0,0Uruguay 3,8 64,6 20,5 5,1 -2,2Venezuela 13,1 51,6 48,4 23,8 14,8(*) Variación anual promedioFuente: <strong>Centro</strong> <strong>de</strong> Economía <strong>Internacional</strong> en base a fuentes nacionales y FMI<strong>Revista</strong> <strong><strong>de</strong>l</strong> <strong>CEI</strong>Comercio Exterior e Integración142
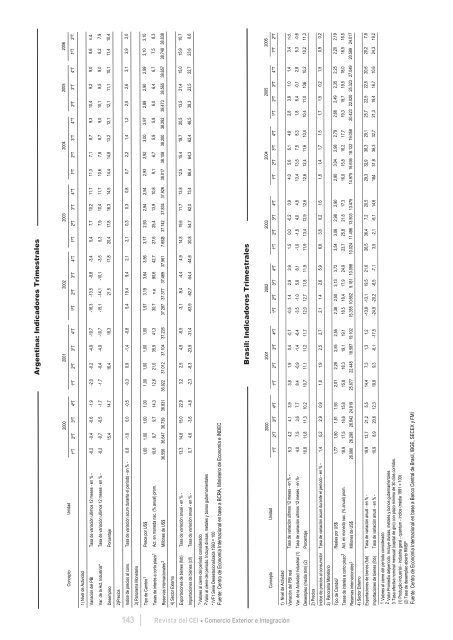
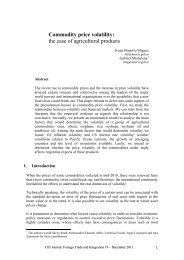
1) Nivel <strong>de</strong> Actividad2)Precios3) Panorama Monetario4) Sector Externo* IVF1 Serie Desestacionalizada 1993 = 100Fuente: <strong>Centro</strong> <strong>de</strong> Economía <strong>Internacional</strong> en base a BCRA, Ministerio <strong>de</strong> Economía e INDEC1) Nivel <strong>de</strong> Actividad2) PreciosConcepto Unidad3) Panorama MonetarioTipo <strong>de</strong> CambioReservas internacionales4) Sector ExternoConcepto UnidadArgentina: Indicadores Trimestrales1 Reales por US$ 1,77 1,80 1,81 1,93 2,01 2,29 2,55 2,55 2,38 2,50 3,13 3,72 3,54 3,06 2,98 2,90 2,90 3,04 2,98 2,79 2,66 2,49 2,35 2,25 2,20 2,192 Millones <strong>de</strong> US$ 26.090 26.290 26.642 24.919 25.677 22.448 18.587 19.102 15.355 10.662 9.181 10.098 10.024 11.496 13.503 13.475 14.975 16.636 18.122 19.058 20.423 22.020 25.323 27.049 20.589 24.017(1) Produção industrial - indústria geral - quantum - índice (média 1991 = 100)(2) Tasa <strong>de</strong> <strong>de</strong>sempleo abierto RMSPFuente: <strong>Centro</strong> <strong>de</strong> Economía <strong>Internacional</strong> en base a Banco Central <strong>de</strong> Brasil, IBGE, SECEX y FMIBrasil: Indicadores TrimestralesImportaciones <strong>de</strong> bienes (fob) Tasa <strong>de</strong> variación anual - en % - 10,9 8,9 20,6 12,3 19,9 9,3 -8,1 -17,5 -24,9 -20,2 -6,5 -7,1 3,5 -2,1 -6,1 14,6 18,4 31,8 36,3 32,7 21,3 19,4 18,7 10,6 24,3 19,2Exportaciones <strong>de</strong> bienes (fob) Tasa <strong>de</strong> variación anual - en % - 19,9 13,7 21,2 5,5 14,4 7,3 1,3 1,2 -13,8 -13,1 19,5 21,6 26,5 36,4 7,2 20,5 29,3 32,9 36,3 29,1 25,7 22,5 22,5 20,6 20,2 7,8Tasas <strong>de</strong> interés a corto plazo 3 Act. en moneda nac. (% anual) prom. 18,9 17,5 16,6 15,8 15,8 18,3 19,1 19,1 18,5 18,4 17,9 24,9 23,7 25,8 21,8 17,3 16,0 15,8 16,2 17,7 19,3 19,7 19,5 18,0 16,5 16,5Indice <strong>de</strong> precios al consumidor Tasa <strong>de</strong> variación acum durante el período - en % - 1,4 0,2 2,9 0,9 1,8 1,9 2,5 2,7 2,1 1,4 2,6 5,9 6,8 3,8 0,2 1,6 1,8 1,4 1,7 1,5 1,7 1,5 0,2 1,5 0,9 0,2Desempleo (media trim) (2) Porcentaje 10,8 11,8 11,3 10,2 10,7 11,1 11,2 11,7 12,0 12,7 11,8 11,9 11,9 13,4 12,9 12,6 12,6 12,4 11,6 10,4 10,4 11,0 10,6 10,2 10,2 11,3Var. <strong>de</strong> la Actividad Industrial (1) Tasa <strong>de</strong> variación ultimos 12 meses - en %- 4,0 7,5 3,6 7,7 8,4 -0,9 -1,4 -6,4 -3,5 -1,0 5,8 8,1 -1,0 -1,8 4,0 4,8 13,4 13,5 7,5 8,3 1,8 6,4 -0,1 2,8 5,3 -0,6Variación <strong><strong>de</strong>l</strong> PBI real Tasa <strong>de</strong> variación ultimos 12 meses - en % - 5,3 4,2 4,1 3,9 3,8 1,9 0,4 -0,7 -0,5 1,4 2,9 3,9 1,5 0,0 -0,2 0,9 4,0 5,6 6,1 4,9 2,8 3,9 1,0 1,4 3,4 n.d.1ºT 2ºT 3ºT 4ºT 1ºT 2ºT 3ºT 4ºT 1ºT 2ºT 3ºT 4ºT 1ºT 2ºT 3ºT 4ºT 1ºT 2ºT 3ºT 4ºT 1ºT 2ºT 3ºT 4*T 1ºT 2ºTImportaciones <strong>de</strong> bienes (cif) Tasa <strong>de</strong> variación anual - en % - 0,7 4,6 -3,6 -4,8 -2,3 -8,3 -23,9 -31,4 -63,9 -62,7 -54,4 -44,6 20,8 54,7 62,0 73,4 86,4 64,3 62,4 46,5 38,3 23,5 22,7 23,6 8,6Exportaciones <strong>de</strong> bienes (fob) Tasa <strong>de</strong> variación anual - en % - 13,3 14,8 15,0 22,9 3,2 2,5 4,9 -6,5 -3,1 -9,4 -4,4 4,9 14,8 19,6 11,7 13,8 12,5 15,4 18,7 20,5 13,5 21,4 15,0 15,9 10,7Tasas <strong>de</strong> interés a corto plazo 1 Act. en moneda nac. (% anual) prom. 10,6 9,7 9,7 14,3 12,6 21,0 35,9 41,3 30,7 n.a. 90,6 42,7 27,6 25,4 13,9 10,8 9,1 6,7 5,9 5,8 6,0 6,4 6,7 7,5 8,3Tipo <strong>de</strong> Cambio 1 Pesos por US$ 1,00 1,00 1,00 1,00 1,00 1,00 1,00 1,00 1,97 3,19 3,64 3,56 3,17 2,93 2,94 2,94 2,93 2,92 3,00 2,97 2,89 2,90 2,99 3,10 3,10Indice <strong>de</strong> precios al cons. Tasa <strong>de</strong> variación acum durante el período - en % - 0,8 -1,0 0,0 -0,5 -0,3 0,9 -1,4 -0,8 5,4 19,4 9,4 2,1 2,1 0,3 0,3 0,8 0,7 2,2 1,4 1,2 2,0 2,6 3,1 2,9 2,0Desempleo Porcentaje 15,4 14,7 16,4 18,3 21,5 17,8 20,4 17,8 16,3 14,5 14,4 14,8 13,2 12,1 12,1 11,1 10,1 11,4 10,4Var. <strong>de</strong> la Act. Industrial* Tasa <strong>de</strong> variación ultimos 12 meses - en % - -0,2 -0,7 -0,5 -1,7 -1,7 -0,4 -4,9 -10,7 -15,1 -14,1 -10,1 -3,5 5,3 7,9 10,4 11,7 10,6 7,8 8,7 9,0 10,1 9,5 9,0 8,2 7,9Variación <strong><strong>de</strong>l</strong> PBI Tasa <strong>de</strong> variación ultimos 12 meses - en % - -0,2 -0,4 -0,6 -1,9 -2,0 -0,2 -4,9 -10,7 -16,3 -13,5 -9,8 -3,4 5,4 7,7 10,2 11,7 11,3 7,1 8,7 9,3 10,4 9,2 9,0 8,6 n.d.1ºT 2ºT 3ºT 4ºT 1ºT 2ºT 3*T 4*T 1ºT 2ºT 3*T 4*T 1ºT 2ºT 3*T 4*T 1ºT 2ºT 3*T 4*T 2ºT 3*T 4*T 1ºT 2ºTReservas internacionales 2 Millones <strong>de</strong> US$ 36.556 36.647 36.739 36.831 36.922 37.012 37.104 37.226 37.287 37.377 37.469 37.561 7.652 3 37.742 37.834 37.926 38.017 38.108 38.200 38.292 38.473 38.565 38.657 38.748 38.8382000 2001 2002 2003 2004 2005 20062000 2001 2002 2003 2004 2005 20061Valores al cierre <strong><strong>de</strong>l</strong> período consi<strong>de</strong>rado2Valor al cierre <strong><strong>de</strong>l</strong> período. Incluye divisas, metales y bonos gubernamentales1 Valores al cierre <strong><strong>de</strong>l</strong> período consi<strong>de</strong>rado2 Valor Promedio <strong><strong>de</strong>l</strong>período. Incluye divisas, metales y bonos gubernamentales3 Tasa efectiva nominal mensual (capital <strong>de</strong> giro) con plazo mínimo <strong>de</strong> 30 días corridos.143 <strong>Revista</strong> <strong><strong>de</strong>l</strong> <strong>CEI</strong> Comercio Exterior e Integración
- Page 1 and 2:
Revista del CEIComercio Exterior e
- Page 3:
SUMARIOCOYUNTURA COMERCIALEstructur
- Page 7 and 8:
PresentaciónLa sección de coyuntu
- Page 13 and 14:
G r á f i c o 3Diversificación de
- Page 15 and 16:
Las exportaciones de productos prim
- Page 17 and 18:
Relacionado con la evolución que v
- Page 19 and 20:
Vinculado al fuerte crecimiento que
- Page 21 and 22:
Este efecto fue revertido principal
- Page 23 and 24:
Aun así, merecen destacarse al men
- Page 25 and 26:
Cuadro A 1Evolución del saldo de b
- Page 28 and 29:
Cuadro A 4Exportaciones e índice d
- Page 30 and 31:
Cuadro A 6Saldo de balanza comercia
- Page 32 and 33:
las exportaciones en concepto de vi
- Page 34 and 35:
G r á f i c o 3Valor y cambio abso
- Page 36 and 37:
como lo son Egipto, Nigeria, Venezu
- Page 38 and 39:
G r á f i c o 2Crecimiento de las
- Page 40 and 41:
El total exportado también se encu
- Page 42 and 43:
Del Cuadro 1 se desprende una asoci
- Page 44 and 45:
En el primer semestre del año, el
- Page 46 and 47:
Vehículos de navegación aérea, m
- Page 48 and 49:
Unidos. En todos los casos menciona
- Page 50 and 51:
BibliografíaCastagnino, T. (2006).
- Page 52 and 53:
Cuadro A 2G R Á F I C O 1:Exportac
- Page 54 and 55:
Cuadro A 4Exportaciones e índice d
- Page 56 and 57:
Cuadro A 6Saldo de balanza comercia
- Page 58 and 59:
las exportaciones en concepto de vi
- Page 60 and 61:
G r á f i c o 3Valor y cambio abso
- Page 62 and 63:
Se mantiene eldinamismo del BloqueH
- Page 64 and 65:
vez como miembro pleno, en junio tu
- Page 66 and 67:
en el primer semestre del año.Las
- Page 68 and 69:
septiembre del año pasado un baja
- Page 70 and 71:
considera que al cierre del año la
- Page 72 and 73:
dólares norteamericanos, asciende
- Page 74 and 75:
Ambición y equilibrioen la Ronda D
- Page 76 and 77:
3. Resultados mínimos de las conce
- Page 78 and 79:
La aplicación de la propuesta menc
- Page 80 and 81:
4. La ambición y el equilibrio nec
- Page 82 and 83:
El ingreso deVenezuela al Mercosur:
- Page 84 and 85:
A 2006 la estructura arancelaria vi
- Page 86 and 87:
En principio la Argentina participa
- Page 88 and 89:
hubieron otros donde la participaci
- Page 90 and 91:
se puede establecer, según datos d
- Page 92 and 93:
La otra metodología que se utiliza
- Page 94 and 95:
Asimismo, reconoce que la prestaci
- Page 96 and 97:
problema debido a que en el Anexo D
- Page 98 and 99:
Según lo observado en los procesos
- Page 100 and 101:
Trade Facilitation:Definitions, WTO
- Page 102 and 103:
se puede establecer, según datos d
- Page 104 and 105:
La otra metodología que se utiliza
- Page 106 and 107:
Asimismo, reconoce que la prestaci
- Page 108 and 109:
problema debido a que en el Anexo D
- Page 110 and 111:
Según lo observado en los procesos
- Page 112 and 113:
Australia - Argentina:convergencias
- Page 114 and 115:
Artículosde 2002 en adelante, por
- Page 116 and 117:
Artículosaustraliano), para la rat
- Page 118 and 119:
Artículosimportantes inversiones y
- Page 120 and 121:
Artículossociales de carácter mod
- Page 122 and 123:
Artículospagos de la Administraci
- Page 124 and 125:
Artículosmayor libertad de acción
- Page 126 and 127:
ArtículosLa disminución del peso
- Page 128 and 129:
Artículospor 6.490 millones de dó
- Page 130 and 131:
ArtículosLos datos anteriores evid
- Page 132 and 133:
ArtículosAustralia a Canberra en 1
- Page 134 and 135:
Artículossentaron el 25,0% del tot
- Page 136 and 137:
ArtículosBibliografíaAustralian B
- Page 138 and 139:
El análisis cuantitativo de lapol
- Page 140 and 141:
ArtículosSimulacionesLa metodolog
- Page 142 and 143:
Artículoscomo así también insumo
- Page 144 and 145:
Artículosdiante la matriz inversa
- Page 146 and 147:
ArtículosLas estimaciones realizad
- Page 148 and 149:
SummaryAustralia - Argentina:Conver
- Page 150 and 151: evealed by growing political and cu
- Page 152 and 153: Governor-General proposing the pers
- Page 154 and 155: enabled a symmetrical growth in the
- Page 156 and 157: 3. Recent EvolutionThe information,
- Page 158 and 159: science and technology. The last es
- Page 160 and 161: Table 5Employment and Unemploymentp
- Page 162 and 163: Table 7High Human Development Index
- Page 164 and 165: It can be stated that Australia has
- Page 166 and 167: 3. Balance of Payments and Foreign
- Page 168 and 169: end of 2006. For the very first tim
- Page 170 and 171: Budget surplus has a counter-cyclic
- Page 172 and 173: plantations, food industries, cold
- Page 174 and 175: The One Thousand Faces ofAgricultur
- Page 176 and 177: A fines de la década de los 50, cu
- Page 178 and 179: estratégicos que efectúan los pa
- Page 180 and 181: subsidios (es más, sólo el 5 por
- Page 182 and 183: de exportar aeronaves y de no afron
- Page 184 and 185: deberíamos suponer que habría una
- Page 186 and 187: tienen jerarquía de tratado intern
- Page 188 and 189: Con el establecimiento de la OMC se
- Page 190 and 191: 3. Para completar el tercer aspecto
- Page 192 and 193: 5 Anexo
- Page 194 and 195: AnexoPIB a precios y tipos de cambi
- Page 196 and 197: AnexoSaldo de la Cuenta Corrienteen
- Page 198 and 199: AnexoTasas de Desempleopromedio anu