Revista del CEI - Centro de EconomÃa Internacional
Revista del CEI - Centro de EconomÃa Internacional
Revista del CEI - Centro de EconomÃa Internacional

Create successful ePaper yourself
Turn your PDF publications into a flip-book with our unique Google optimized e-Paper software.
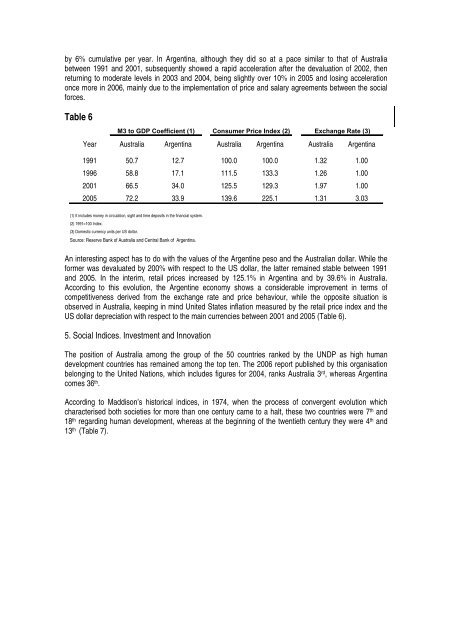
y 6% cumulative per year. In Argentina, although they did so at a pace similar to that of Australiabetween 1991 and 2001, subsequently showed a rapid acceleration after the <strong>de</strong>valuation of 2002, thenreturning to mo<strong>de</strong>rate levels in 2003 and 2004, being slightly over 10% in 2005 and losing accelerationonce more in 2006, mainly due to the implementation of price and salary agreements between the socialforces.Table 6M3 to GDP Coefficient (1) Consumer Price In<strong>de</strong>x (2) Exchange Rate (3)Year Australia Argentina Australia Argentina Australia Argentina1991 50.7 12.7 100.0 100.0 1.32 1.001996 58.8 17.1 111.5 133.3 1.26 1.002001 66.5 34.0 125.5 129.3 1.97 1.002005 72.2 33.9 139.6 225.1 1.31 3.03(1) It inclu<strong>de</strong>s money in circulation, sight and time <strong>de</strong>posits in the financial system.(2) 1991=100 In<strong>de</strong>x.(3) Domestic currency units per US dollar.Source: Reserve Bank of Australia and Central Bank of Argentina.An interesting aspect has to do with the values of the Argentine peso and the Australian dollar. While theformer was <strong>de</strong>valuated by 200% with respect to the US dollar, the latter remained stable between 1991and 2005. In the interim, retail prices increased by 125.1% in Argentina and by 39.6% in Australia.According to this evolution, the Argentine economy shows a consi<strong>de</strong>rable improvement in terms ofcompetitiveness <strong>de</strong>rived from the exchange rate and price behaviour, while the opposite situation isobserved in Australia, keeping in mind United States inflation measured by the retail price in<strong>de</strong>x and theUS dollar <strong>de</strong>preciation with respect to the main currencies between 2001 and 2005 (Table 6).5. Social Indices. Investment and InnovationThe position of Australia among the group of the 50 countries ranked by the UNDP as high human<strong>de</strong>velopment countries has remained among the top ten. The 2006 report published by this organisationbelonging to the United Nations, which inclu<strong>de</strong>s figures for 2004, ranks Australia 3 rd , whereas Argentinacomes 36 th .According to Maddison’s historical indices, in 1974, when the process of convergent evolution whichcharacterised both societies for more than one century came to a halt, these two countries were 7 th and18 th regarding human <strong>de</strong>velopment, whereas at the beginning of the twentieth century they were 4 th and13 th (Table 7).