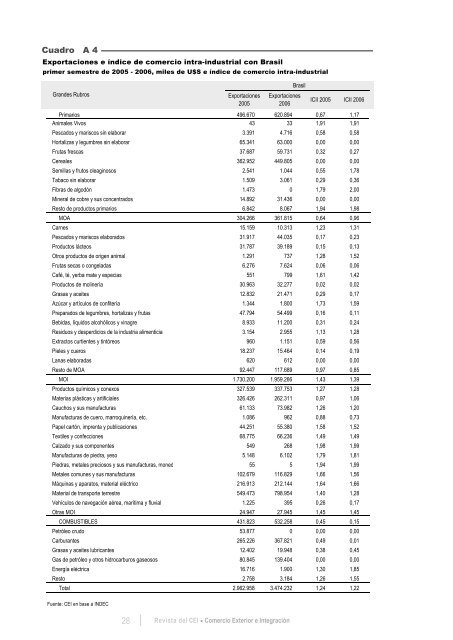
Cuadro A 4Exportaciones e índice <strong>de</strong> comercio intra-industrial con Brasilprimer semestre <strong>de</strong> 2005 - 2006, miles <strong>de</strong> U$S e índice <strong>de</strong> comercio intra-industrialGran<strong>de</strong>s RubrosExportaciones2005BrasilExportaciones2006ICII 2005 ICII 2006Primarios496.670 620.894 0,67 1,17Animales Vivos 43 33 1,91 1,91Pescados y mariscos sin elaborar 3.391 4.716 0,58 0,58Hortalizas y legumbres sin elaborar 65.341 63.000 0,00 0,00Frutas frescas 37.687 59.731 0,32 0,27Cereales 362.952 449.805 0,00 0,00Semillas y frutos oleaginosos 2.541 1.044 0,55 1,78Tabaco sin elaborar 1.509 3.061 0,29 0,36Fibras <strong>de</strong> algodón 1.473 0 1,79 2,00Mineral <strong>de</strong> cobre y sus concentrados 14.892 31.436 0,00 0,00Resto <strong>de</strong> productos primarios 6.842 8.067 1,94 1,98MOA304.266 361.815 0,64 0,96Carnes 15.159 10.313 1,23 1,31Pescados y mariscos elaborados 31.917 44.035 0,17 0,23Productos lácteos 31.787 39.189 0,15 0,13Otros productos <strong>de</strong> origen animal 1.291 737 1,28 1,52Frutas secas o congeladas 6.276 7.624 0,06 0,06Café, té, yerba mate y especias 551 799 1,61 1,42Productos <strong>de</strong> molinería 30.963 32.277 0,02 0,02Grasas y aceites 12.832 21.471 0,29 0,17Azúcar y artículos <strong>de</strong> confitería 1.344 1.800 1,73 1,59Preparados <strong>de</strong> legumbres, hortalizas y frutas 47.794 54.499 0,16 0,11Bebidas, líquidos alcohólicos y vinagre 8.933 11.200 0,31 0,24Residuos y <strong>de</strong>sperdicios <strong>de</strong> la industria alimenticia 3.154 2.955 1,13 1,28Extractos curtientes y tintóreos 960 1.151 0,59 0,56Pieles y cueros 18.237 15.464 0,14 0,19Lanas elaboradas 620 612 0,00 0,00Resto <strong>de</strong> MOA 92.447 117.689 0,97 0,85MOI1.730.200 1.959.266 1,43 1,39Productos químicos y conexos 327.539 337.753 1,27 1,28Materias plásticas y artificiales 326.426 262.311 0,97 1,06Cauchos y sus manufacturas 61.133 73.982 1,26 1,20Manufacturas <strong>de</strong> cuero, marroquinería, etc. 1.086 962 0,88 0,73Papel cartón, imprenta y publicaciones 44.251 55.380 1,58 1,52Textiles y confecciones 68.775 66.236 1,49 1,49Calzado y sus componentes 549 268 1,98 1,99Manufacturas <strong>de</strong> piedra, yeso 5.148 6.102 1,79 1,81Piedras, metales preciosos y sus manufacturas, moned 55 5 1,94 1,99Metales comunes y sus manufacturas 102.679 116.829 1,66 1,56Máquinas y aparatos, material eléctrico 216.913 212.144 1,64 1,66Material <strong>de</strong> transporte terrestre 549.473 798.954 1,40 1,28Vehículos <strong>de</strong> navegación aérea, marítima y fluvial 1.225 395 0,26 0,17Otras MOI 24.947 27.945 1,45 1,45COMBUSTIBLES431.823 532.258 0,45 0,15Petróleo crudo 53.877 0 0,00 0,00Carburantes 265.226 367.821 0,49 0,01Grasas y aceites lubricantes 12.402 19.948 0,38 0,45Gas <strong>de</strong> petróleo y otros hidrocarburos gaseosos 80.845 139.404 0,00 0,00Energía eléctrica 16.716 1.900 1,30 1,85Resto 2.758 3.184 1,26 1,55Total2.962.958 3.474.232 1,24 1,22Fuente: <strong>CEI</strong> en base a INDEC28 <strong>Revista</strong> <strong><strong>de</strong>l</strong> <strong>CEI</strong> Comercio Exterior e Integración
Cuadro A 5Exportaciones e índice <strong>de</strong> comercio intra-industrial con el resto <strong><strong>de</strong>l</strong> mundoprimer semestre <strong>de</strong> 2005 - 2006, miles <strong>de</strong> U$S e índice <strong>de</strong> comercio intra-industrialCoyuntura ComercialGran<strong>de</strong>s RubrosPrimariosAnimales VivosPescados y mariscos sin elaborarMielHortalizas y legumbres sin elaborarFrutas frescasCerealesSemillas y frutos oleaginososTabaco sin elaborarLanas suciasFibras <strong>de</strong> algodónMineral <strong>de</strong> cobre y sus concentradosResto <strong>de</strong> productos primariosMOACarnesPescados y mariscos elaboradosProductos lácteosOtros productos <strong>de</strong> origen animalFrutas secas o congeladasCafé, té, yerba mate y especiasProductos <strong>de</strong> molineríaGrasas y aceitesAzúcar y artículos <strong>de</strong> confiteríaPreparados <strong>de</strong> legumbres, hortalizas y frutasBebidas, líquidos alcohólicos y vinagreResiduos y <strong>de</strong>sperdicios <strong>de</strong> la industria alimenticiaExtractos curtientes y tintóreosPieles y cuerosLanas elaboradasResto <strong>de</strong> MOAMOIProductos químicos y conexosMaterias plásticas y artificialesCauchos y sus manufacturasManufacturas <strong>de</strong> cuero, marroquinería, etc.Papel cartón, imprenta y publicacionesTextiles y confeccionesCalzado y sus componentesManufacturas <strong>de</strong> piedra, yeso, etc, productos cerámicos, vidrio y sus manuf.Piedras, metales preciosos y sus manufacturas, monedasMetales comunes y sus manufacturasMáquinas y aparatos, material eléctricoMaterial <strong>de</strong> transporte terrestreVehículos <strong>de</strong> navegación aérea, marítima y fluvialOtras MOICombustiblesPetróleo crudoCarburantesGrasas y aceites lubricantesGas <strong>de</strong> petróleo y otros hidrocarburos gaseososEnergía eléctricaRestoTotalFuente: <strong>CEI</strong> en base a INDECExportaciones2005Resto <strong><strong>de</strong>l</strong> MundoExportaciones2006ICII 2005 ICII 20063.890.740 4.014.795 0,12 0,188.858 8.265 0,48 0,42275.555 350.623 0,03 0,0466.580 79.213 0,00 0,0050.464 58.432 0,19 0,13434.463 380.505 0,10 0,201.287.778 862.243 0,00 0,001.367.616 1.214.460 0,16 0,2080.617 76.688 0,21 0,2121.589 17.639 0,10 0,2011.445 242 0,00 1,92254.597 924.842 0,00 0,0031.176 41.642 1,46 1,665.710.848 6.495.019 0,09 0,08738.916 591.623 0,02 0,03143.804 164.331 0,23 0,22245.841 298.415 0,02 0,0213.939 16.551 0,71 0,7824.308 38.053 0,06 0,0537.469 39.856 0,15 0,1212.715 14.362 0,27 0,361.553.647 1.770.545 0,02 0,0250.108 86.706 0,11 0,09161.020 223.329 0,15 0,14140.803 178.864 0,15 0,121.832.566 2.239.220 0,01 0,0117.030 20.739 0,37 0,26390.850 421.095 0,07 0,0967.781 72.242 0,01 0,01280.051 319.085 0,69 0,613.756.534 4.545.157 1,33 1,27742.023 804.743 1,38 1,40240.364 320.035 1,27 1,1154.262 70.864 1,46 1,3349.533 55.626 0,57 0,60192.604 207.696 1,09 1,1069.424 76.186 1,53 1,5012.799 15.170 1,33 1,4862.328 72.185 1,10 1,1373.431 227.979 0,39 0,171.009.919 1.013.895 0,68 0,69404.892 455.195 1,75 1,73673.219 883.508 0,94 0,9125.605 169.545 1,84 0,98146.131 172.528 1,50 1,452.700.121 2.965.367 0,42 0,581.189.978 1.033.841 0,06 0,05890.825 1.146.490 0,52 0,6545.497 61.298 0,95 0,86461.581 580.245 0,31 0,6355.254 96.177 1,34 1,0156.986 47.316 1,36 1,6616.058.243 18.020.338 0,70 0,70<strong>Revista</strong> <strong><strong>de</strong>l</strong> <strong>CEI</strong>Comercio Exterior e Integración29
- Page 1 and 2:
Revista del CEIComercio Exterior e
- Page 3: SUMARIOCOYUNTURA COMERCIALEstructur
- Page 7 and 8: PresentaciónLa sección de coyuntu
- Page 13 and 14: G r á f i c o 3Diversificación de
- Page 15 and 16: Las exportaciones de productos prim
- Page 17 and 18: Relacionado con la evolución que v
- Page 19 and 20: Vinculado al fuerte crecimiento que
- Page 21 and 22: Este efecto fue revertido principal
- Page 23 and 24: Aun así, merecen destacarse al men
- Page 25 and 26: Cuadro A 1Evolución del saldo de b
- Page 28 and 29: Cuadro A 4Exportaciones e índice d
- Page 30 and 31: Cuadro A 6Saldo de balanza comercia
- Page 32 and 33: las exportaciones en concepto de vi
- Page 34 and 35: G r á f i c o 3Valor y cambio abso
- Page 36 and 37: como lo son Egipto, Nigeria, Venezu
- Page 38 and 39: G r á f i c o 2Crecimiento de las
- Page 40 and 41: El total exportado también se encu
- Page 42 and 43: Del Cuadro 1 se desprende una asoci
- Page 44 and 45: En el primer semestre del año, el
- Page 46 and 47: Vehículos de navegación aérea, m
- Page 48 and 49: Unidos. En todos los casos menciona
- Page 50 and 51: BibliografíaCastagnino, T. (2006).
- Page 52 and 53: Cuadro A 2G R Á F I C O 1:Exportac
- Page 56 and 57: Cuadro A 6Saldo de balanza comercia
- Page 58 and 59: las exportaciones en concepto de vi
- Page 60 and 61: G r á f i c o 3Valor y cambio abso
- Page 62 and 63: Se mantiene eldinamismo del BloqueH
- Page 64 and 65: vez como miembro pleno, en junio tu
- Page 66 and 67: en el primer semestre del año.Las
- Page 68 and 69: septiembre del año pasado un baja
- Page 70 and 71: considera que al cierre del año la
- Page 72 and 73: dólares norteamericanos, asciende
- Page 74 and 75: Ambición y equilibrioen la Ronda D
- Page 76 and 77: 3. Resultados mínimos de las conce
- Page 78 and 79: La aplicación de la propuesta menc
- Page 80 and 81: 4. La ambición y el equilibrio nec
- Page 82 and 83: El ingreso deVenezuela al Mercosur:
- Page 84 and 85: A 2006 la estructura arancelaria vi
- Page 86 and 87: En principio la Argentina participa
- Page 88 and 89: hubieron otros donde la participaci
- Page 90 and 91: se puede establecer, según datos d
- Page 92 and 93: La otra metodología que se utiliza
- Page 94 and 95: Asimismo, reconoce que la prestaci
- Page 96 and 97: problema debido a que en el Anexo D
- Page 98 and 99: Según lo observado en los procesos
- Page 100 and 101: Trade Facilitation:Definitions, WTO
- Page 102 and 103: se puede establecer, según datos d
- Page 104 and 105:
La otra metodología que se utiliza
- Page 106 and 107:
Asimismo, reconoce que la prestaci
- Page 108 and 109:
problema debido a que en el Anexo D
- Page 110 and 111:
Según lo observado en los procesos
- Page 112 and 113:
Australia - Argentina:convergencias
- Page 114 and 115:
Artículosde 2002 en adelante, por
- Page 116 and 117:
Artículosaustraliano), para la rat
- Page 118 and 119:
Artículosimportantes inversiones y
- Page 120 and 121:
Artículossociales de carácter mod
- Page 122 and 123:
Artículospagos de la Administraci
- Page 124 and 125:
Artículosmayor libertad de acción
- Page 126 and 127:
ArtículosLa disminución del peso
- Page 128 and 129:
Artículospor 6.490 millones de dó
- Page 130 and 131:
ArtículosLos datos anteriores evid
- Page 132 and 133:
ArtículosAustralia a Canberra en 1
- Page 134 and 135:
Artículossentaron el 25,0% del tot
- Page 136 and 137:
ArtículosBibliografíaAustralian B
- Page 138 and 139:
El análisis cuantitativo de lapol
- Page 140 and 141:
ArtículosSimulacionesLa metodolog
- Page 142 and 143:
Artículoscomo así también insumo
- Page 144 and 145:
Artículosdiante la matriz inversa
- Page 146 and 147:
ArtículosLas estimaciones realizad
- Page 148 and 149:
SummaryAustralia - Argentina:Conver
- Page 150 and 151:
evealed by growing political and cu
- Page 152 and 153:
Governor-General proposing the pers
- Page 154 and 155:
enabled a symmetrical growth in the
- Page 156 and 157:
3. Recent EvolutionThe information,
- Page 158 and 159:
science and technology. The last es
- Page 160 and 161:
Table 5Employment and Unemploymentp
- Page 162 and 163:
Table 7High Human Development Index
- Page 164 and 165:
It can be stated that Australia has
- Page 166 and 167:
3. Balance of Payments and Foreign
- Page 168 and 169:
end of 2006. For the very first tim
- Page 170 and 171:
Budget surplus has a counter-cyclic
- Page 172 and 173:
plantations, food industries, cold
- Page 174 and 175:
The One Thousand Faces ofAgricultur
- Page 176 and 177:
A fines de la década de los 50, cu
- Page 178 and 179:
estratégicos que efectúan los pa
- Page 180 and 181:
subsidios (es más, sólo el 5 por
- Page 182 and 183:
de exportar aeronaves y de no afron
- Page 184 and 185:
deberíamos suponer que habría una
- Page 186 and 187:
tienen jerarquía de tratado intern
- Page 188 and 189:
Con el establecimiento de la OMC se
- Page 190 and 191:
3. Para completar el tercer aspecto
- Page 192 and 193:
5 Anexo
- Page 194 and 195:
AnexoPIB a precios y tipos de cambi
- Page 196 and 197:
AnexoSaldo de la Cuenta Corrienteen
- Page 198 and 199:
AnexoTasas de Desempleopromedio anu
- Page 200 and 201:
AnexoTasas de inflación (Precios M


