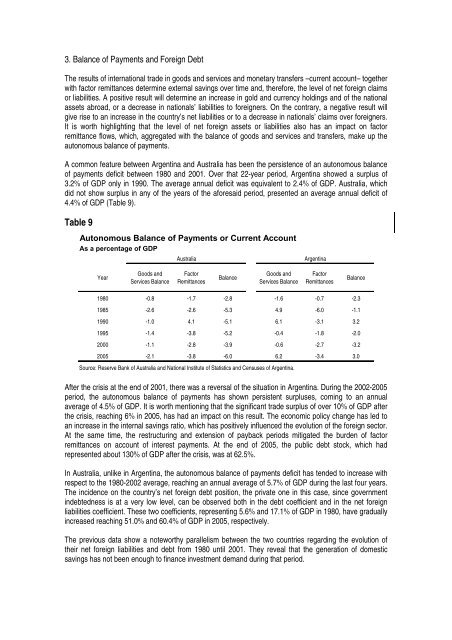
3. Balance of Payments and Foreign DebtThe results of international tra<strong>de</strong> in goods and services and monetary transfers –current account– togetherwith factor remittances <strong>de</strong>termine external savings over time and, therefore, the level of net foreign claimsor liabilities. A positive result will <strong>de</strong>termine an increase in gold and currency holdings and of the nationalassets abroad, or a <strong>de</strong>crease in nationals’ liabilities to foreigners. On the contrary, a negative result willgive rise to an increase in the country’s net liabilities or to a <strong>de</strong>crease in nationals’ claims over foreigners.It is worth highlighting that the level of net foreign assets or liabilities also has an impact on factorremittance flows, which, aggregated with the balance of goods and services and transfers, make up theautonomous balance of payments.A common feature between Argentina and Australia has been the persistence of an autonomous balanceof payments <strong>de</strong>ficit between 1980 and 2001. Over that 22-year period, Argentina showed a surplus of3.2% of GDP only in 1990. The average annual <strong>de</strong>ficit was equivalent to 2.4% of GDP. Australia, whichdid not show surplus in any of the years of the aforesaid period, presented an average annual <strong>de</strong>ficit of4.4% of GDP (Table 9).Table 9Autonomous Balance of Payments or Current AccountAs a percentage of GDPAustraliaArgentinaYearGoods andServices BalanceFactorRemittancesBalanceGoods andServices BalanceFactorRemittancesBalance1980 -0.8 -1.7 -2.8 -1.6 -0.7 -2.31985 -2.6 -2.6 -5.3 4.9 -6.0 -1.11990 -1.0 4.1 -5.1 6.1 -3.1 3.21995 -1.4 -3.8 -5.2 -0.4 -1.8 -2.02000 -1.1 -2.8 -3.9 -0.6 -2.7 -3.22005 -2.1 -3.8 -6.0 6.2 -3.4 3.0Source: Reserve Bank of Australia and National Institute of Statistics and Censuses of Argentina.After the crisis at the end of 2001, there was a reversal of the situation in Argentina. During the 2002-2005period, the autonomous balance of payments has shown persistent surpluses, coming to an annualaverage of 4.5% of GDP. It is worth mentioning that the significant tra<strong>de</strong> surplus of over 10% of GDP afterthe crisis, reaching 6% in 2005, has had an impact on this result. The economic policy change has led toan increase in the internal savings ratio, which has positively influenced the evolution of the foreign sector.At the same time, the restructuring and extension of payback periods mitigated the bur<strong>de</strong>n of factorremittances on account of interest payments. At the end of 2005, the public <strong>de</strong>bt stock, which hadrepresented about 130% of GDP after the crisis, was at 62.5%.In Australia, unlike in Argentina, the autonomous balance of payments <strong>de</strong>ficit has ten<strong>de</strong>d to increase withrespect to the 1980-2002 average, reaching an annual average of 5.7% of GDP during the last four years.The inci<strong>de</strong>nce on the country’s net foreign <strong>de</strong>bt position, the private one in this case, since governmentin<strong>de</strong>btedness is at a very low level, can be observed both in the <strong>de</strong>bt coefficient and in the net foreignliabilities coefficient. These two coefficients, representing 5.6% and 17.1% of GDP in 1980, have graduallyincreased reaching 51.0% and 60.4% of GDP in 2005, respectively.The previous data show a noteworthy parallelism between the two countries regarding the evolution oftheir net foreign liabilities and <strong>de</strong>bt from 1980 until 2001. They reveal that the generation of domesticsavings has not been enough to finance investment <strong>de</strong>mand during that period.
In Argentina, in spite of the trend reversal over the past four years, the investment required by economicgrowth and that called for in or<strong>de</strong>r to overcome the social situation arising from the crisis, require an evenhigher savings coefficient than the current one, consi<strong>de</strong>ring the public <strong>de</strong>bt repayment needs, the need forsufficient investment to guarantee continuous growth, and the recovery of the social pattern whichcharacterised the country in the past. In this respect, the fact that the normalisation of foreign borrowingwill still take consi<strong>de</strong>rable time has to be taken into account, since this implies that investment financingwill have to be based mainly on domestic resources and foreign direct investment.In Australia, in<strong>de</strong>btedness and foreign liabilities indices are within manageable parameters. However, ifthe ten<strong>de</strong>ncy <strong>de</strong>scribed is to persist, it could compromise economic policy management in the future,requiring important social adjustments in or<strong>de</strong>r to restore the balance between domestic investment andsavings.4. The Future1. A New Trend?Over the past years, substantial political changes have taken place in Argentina. These changes followedthe recession between 1998 and 2001 that en<strong>de</strong>d in a social and economic crisis of almost unprece<strong>de</strong>ntedseverity. The 2002 provisional government and the 2003 elected administration ma<strong>de</strong> a series of <strong>de</strong>cisionswith the aim of reversing the cyclical economic behaviour, modifying the regressive income distributionand improving the quality of institutions. The fourth implementation year of the execution plan is currentlyun<strong>de</strong>rway with significant results in the different fields mentioned.At the institutional level, a far-reaching reform of the judiciary was un<strong>de</strong>rtaken, including the appointmentof new justices. The goals were to consolidate the in<strong>de</strong>pen<strong>de</strong>nce of powers, to guarantee the transparentoperation of the judiciary, and to assure the rule of law for society and economic actors.Economically, the most significant aspects have been a strong fiscal discipline, a floating exchange rate,implementation of export duties for tax collection and income distribution purposes, a mo<strong>de</strong>ratelyexpansive monetary policy and the adoption of active industrial policies and infrastructure investment bythe fe<strong>de</strong>ral and provincial governments. Once the highest peak of the crisis was overcome, new long-termsocial policies began to be outlined, mainly regarding investment in public health care and educationfunding. The corresponding bill creates an increase in the budget share of education, from 4.5% to 6% ofGDP over the following four years. The goals are the enhancement of teachers’ professional wage parity,the coordination of programs at the fe<strong>de</strong>ral and provincial levels, the eradication of any remaining illiteracy,universal secondary schooling, and the re-launch of technical education. Together with the increase in thebudget for science and technology, this represents one of the first hints, after a long time, of the launch oflong-and mid-term programmes, agreed upon through negotiations involving all the relevant social sectors.As for economic policy, the investment component of the fe<strong>de</strong>ral budget was gradually increased parallelto the implementation of exchange rate floating and strict fiscal discipline. The domestic and foreigngovernment <strong>de</strong>bt was restructured so as to obtain a substantial reduction in capital and the reschedulingof payments on a long-term basis. Relative price changes as a result of <strong>de</strong>valuation and greaterinvestment in infrastructure favoured domestic production competitiveness, which was seen in thesignificant expansion of exports, the increase in consumption and investment <strong>de</strong>mands, and inemployment.The early results, consi<strong>de</strong>ring the indicators between 2002 and 2006, show that a slightly lowerdiscrepancy can be seen in the large production, investment and consumption aggregates betweenAustralia and Argentina. The GDP per capita growth in Argentina from 2001 to 2006 was in the region of16.0%, including the effect of the crisis; while in Australia it amounted to 8.7%. Consequently, the ratiobetween both GDP’s per capita at purchasing power parity climbed from 37.1% in 2001 to 39.8% at the
- Page 1 and 2:
Revista del CEIComercio Exterior e
- Page 3:
SUMARIOCOYUNTURA COMERCIALEstructur
- Page 7 and 8:
PresentaciónLa sección de coyuntu
- Page 13 and 14:
G r á f i c o 3Diversificación de
- Page 15 and 16:
Las exportaciones de productos prim
- Page 17 and 18:
Relacionado con la evolución que v
- Page 19 and 20:
Vinculado al fuerte crecimiento que
- Page 21 and 22:
Este efecto fue revertido principal
- Page 23 and 24:
Aun así, merecen destacarse al men
- Page 25 and 26:
Cuadro A 1Evolución del saldo de b
- Page 28 and 29:
Cuadro A 4Exportaciones e índice d
- Page 30 and 31:
Cuadro A 6Saldo de balanza comercia
- Page 32 and 33:
las exportaciones en concepto de vi
- Page 34 and 35:
G r á f i c o 3Valor y cambio abso
- Page 36 and 37:
como lo son Egipto, Nigeria, Venezu
- Page 38 and 39:
G r á f i c o 2Crecimiento de las
- Page 40 and 41:
El total exportado también se encu
- Page 42 and 43:
Del Cuadro 1 se desprende una asoci
- Page 44 and 45:
En el primer semestre del año, el
- Page 46 and 47:
Vehículos de navegación aérea, m
- Page 48 and 49:
Unidos. En todos los casos menciona
- Page 50 and 51:
BibliografíaCastagnino, T. (2006).
- Page 52 and 53:
Cuadro A 2G R Á F I C O 1:Exportac
- Page 54 and 55:
Cuadro A 4Exportaciones e índice d
- Page 56 and 57:
Cuadro A 6Saldo de balanza comercia
- Page 58 and 59:
las exportaciones en concepto de vi
- Page 60 and 61:
G r á f i c o 3Valor y cambio abso
- Page 62 and 63:
Se mantiene eldinamismo del BloqueH
- Page 64 and 65:
vez como miembro pleno, en junio tu
- Page 66 and 67:
en el primer semestre del año.Las
- Page 68 and 69:
septiembre del año pasado un baja
- Page 70 and 71:
considera que al cierre del año la
- Page 72 and 73:
dólares norteamericanos, asciende
- Page 74 and 75:
Ambición y equilibrioen la Ronda D
- Page 76 and 77:
3. Resultados mínimos de las conce
- Page 78 and 79:
La aplicación de la propuesta menc
- Page 80 and 81:
4. La ambición y el equilibrio nec
- Page 82 and 83:
El ingreso deVenezuela al Mercosur:
- Page 84 and 85:
A 2006 la estructura arancelaria vi
- Page 86 and 87:
En principio la Argentina participa
- Page 88 and 89:
hubieron otros donde la participaci
- Page 90 and 91:
se puede establecer, según datos d
- Page 92 and 93:
La otra metodología que se utiliza
- Page 94 and 95:
Asimismo, reconoce que la prestaci
- Page 96 and 97:
problema debido a que en el Anexo D
- Page 98 and 99:
Según lo observado en los procesos
- Page 100 and 101:
Trade Facilitation:Definitions, WTO
- Page 102 and 103:
se puede establecer, según datos d
- Page 104 and 105:
La otra metodología que se utiliza
- Page 106 and 107:
Asimismo, reconoce que la prestaci
- Page 108 and 109:
problema debido a que en el Anexo D
- Page 110 and 111:
Según lo observado en los procesos
- Page 112 and 113:
Australia - Argentina:convergencias
- Page 114 and 115:
Artículosde 2002 en adelante, por
- Page 116 and 117: Artículosaustraliano), para la rat
- Page 118 and 119: Artículosimportantes inversiones y
- Page 120 and 121: Artículossociales de carácter mod
- Page 122 and 123: Artículospagos de la Administraci
- Page 124 and 125: Artículosmayor libertad de acción
- Page 126 and 127: ArtículosLa disminución del peso
- Page 128 and 129: Artículospor 6.490 millones de dó
- Page 130 and 131: ArtículosLos datos anteriores evid
- Page 132 and 133: ArtículosAustralia a Canberra en 1
- Page 134 and 135: Artículossentaron el 25,0% del tot
- Page 136 and 137: ArtículosBibliografíaAustralian B
- Page 138 and 139: El análisis cuantitativo de lapol
- Page 140 and 141: ArtículosSimulacionesLa metodolog
- Page 142 and 143: Artículoscomo así también insumo
- Page 144 and 145: Artículosdiante la matriz inversa
- Page 146 and 147: ArtículosLas estimaciones realizad
- Page 148 and 149: SummaryAustralia - Argentina:Conver
- Page 150 and 151: evealed by growing political and cu
- Page 152 and 153: Governor-General proposing the pers
- Page 154 and 155: enabled a symmetrical growth in the
- Page 156 and 157: 3. Recent EvolutionThe information,
- Page 158 and 159: science and technology. The last es
- Page 160 and 161: Table 5Employment and Unemploymentp
- Page 162 and 163: Table 7High Human Development Index
- Page 164 and 165: It can be stated that Australia has
- Page 168 and 169: end of 2006. For the very first tim
- Page 170 and 171: Budget surplus has a counter-cyclic
- Page 172 and 173: plantations, food industries, cold
- Page 174 and 175: The One Thousand Faces ofAgricultur
- Page 176 and 177: A fines de la década de los 50, cu
- Page 178 and 179: estratégicos que efectúan los pa
- Page 180 and 181: subsidios (es más, sólo el 5 por
- Page 182 and 183: de exportar aeronaves y de no afron
- Page 184 and 185: deberíamos suponer que habría una
- Page 186 and 187: tienen jerarquía de tratado intern
- Page 188 and 189: Con el establecimiento de la OMC se
- Page 190 and 191: 3. Para completar el tercer aspecto
- Page 192 and 193: 5 Anexo
- Page 194 and 195: AnexoPIB a precios y tipos de cambi
- Page 196 and 197: AnexoSaldo de la Cuenta Corrienteen
- Page 198 and 199: AnexoTasas de Desempleopromedio anu
- Page 200 and 201: AnexoTasas de inflación (Precios M