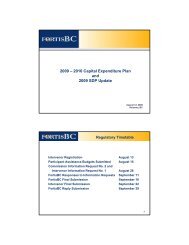
- Page 1 and 2:
October 5, 2012 Via Email Original
- Page 3 and 4:
1 2 3 4 5 6 7 8 9 10 11 12 13 14 15
- Page 5 and 6:
1 2 3 4 5 6 7 8 9 10 11 12 13 14 15
- Page 7 and 8:
1 2 3 4 5 6 7 8 9 10 11 12 13 14 15
- Page 9 and 10:
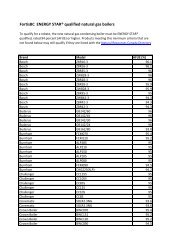
Utility Name Milton Hydro Distribut
- Page 11 and 12:
1 2 3 4 5 6 7 8 9 10 11 12 13 14 15
- Page 13 and 14:
1 2 3 4 5 6 7 8 9 10 11 12 13 14 15
- Page 15 and 16:
1 2 3 4 5 6 7 8 9 10 11 12 13 14 15
- Page 17 and 18:
1 2 3 4 5 6 7 8 9 10 11 12 13 14 15
- Page 19 and 20:
1 2 3 4 5 6 7 8 9 10 11 12 13 14 15
- Page 21 and 22:
1 2 3 4 5 6 7 8 9 10 11 12 13 14 15
- Page 23 and 24:
1 2 3 4 5 6 7 8 9 10 11 12 13 14 15
- Page 25 and 26:
1 2 3 4 5 6 7 8 9 10 11 12 13 14 15
- Page 27 and 28:
1 2 3 4 5 6 7 8 9 10 11 12 13 14 15
- Page 29 and 30:
1 2 3 4 5 6 7 8 9 10 11 12 13 14 15
- Page 31 and 32:
1 2 3 4 5 6 7 8 9 10 11 12 13 14 15
- Page 33 and 34:
1 2 3 4 5 6 7 8 9 10 11 12 13 14 15
- Page 35 and 36:
1 2 3 4 5 6 7 8 9 10 11 12 13 14 15
- Page 37 and 38:
1 2 3 4 5 6 7 8 9 10 11 12 13 14 15
- Page 39 and 40:
1 2 3 4 5 6 7 8 9 10 11 12 13 14 15
- Page 41 and 42:
1 2 3 4 5 6 7 8 9 10 11 12 13 14 15
- Page 43 and 44:
1 2 3 4 5 6 7 8 9 10 11 12 13 14 15
- Page 45 and 46:
1 2 3 4 5 6 7 8 9 10 11 12 13 14 15
- Page 47 and 48:
1 2 3 4 5 6 7 8 9 10 11 12 13 14 15
- Page 49 and 50:
1 2 3 4 5 6 7 8 9 10 11 12 13 14 15
- Page 51 and 52:
1 2 3 4 5 6 7 8 9 10 11 12 13 14 15
- Page 53 and 54:
1 2 3 4 5 6 7 8 9 10 11 12 13 14 15
- Page 55 and 56:
1 2 3 4 5 6 7 8 9 10 11 12 13 14 15
- Page 57 and 58:
1 2 3 4 5 6 7 8 9 10 11 12 13 14 15
- Page 59 and 60:
1 2 3 4 5 6 7 8 Response: FortisBC
- Page 61 and 62:
1 2 3 4 5 6 7 8 9 10 11 12 13 14 15
- Page 63 and 64:
1 2 3 4 5 6 7 8 9 10 11 12 13 14 15
- Page 65 and 66:
1 2 3 4 5 6 7 8 9 10 11 12 13 14 15
- Page 67 and 68:
1 2 3 4 5 6 7 8 9 10 11 12 13 14 15
- Page 69 and 70:
1 2 3 4 5 6 7 8 9 10 11 12 13 14 15
- Page 71 and 72:
ID Task Name Duration Start Finish
- Page 73 and 74:
ID Task Name Duration Start Finish
- Page 75 and 76:
1 2 3 4 5 6 7 8 9 10 11 12 13 14 15
- Page 77 and 78:
1 2 3 4 5 6 7 8 9 10 11 12 13 14 15
- Page 79 and 80:
1 2 3 4 5 6 7 8 9 10 11 12 13 14 15
- Page 81 and 82:
1 2 3 4 5 6 7 8 9 10 11 12 13 14 15
- Page 83 and 84:
1 2 3 4 5 6 7 8 9 10 2013 FortisBC
- Page 85 and 86:
1 FortisBC Inc. (FortisBC or the Co
- Page 87 and 88:
1 2 3 4 5 6 7 8 9 10 11 12 13 14 15
- Page 89 and 90:
1 2 3 4 5 6 7 8 9 10 11 12 13 14 15
- Page 91 and 92:
1 2 3 4 5 6 7 8 9 10 11 12 13 14 15
- Page 93 and 94:
1 2 3 4 5 6 7 8 9 10 11 Response: F
- Page 95 and 96:
1 2 3 4 5 6 7 8 9 10 11 12 13 Respo
- Page 97 and 98:
FortisBC Inc. (FortisBC or the Comp
- Page 99 and 100:
FortisBC Inc. (FortisBC or the Comp
- Page 101 and 102:
1 2 3 FortisBC Inc. (FortisBC or th
- Page 103 and 104:
1 2 3 4 5 6 7 8 9 10 11 12 13 Respo
- Page 105 and 106:
1 2 3 4 5 6 7 8 9 10 11 12 13 14 15
- Page 107 and 108:
1 2 3 4 5 6 7 8 9 10 11 12 13 14 15
- Page 109 and 110:
1 2 3 4 5 6 7 8 9 10 11 12 13 14 15
- Page 111 and 112:
1 2 3 4 5 6 7 8 9 10 11 12 13 14 15
- Page 113 and 114:
1 2 3 4 5 6 7 8 9 10 11 12 13 14 15
- Page 115 and 116:
1 2 3 4 5 6 7 8 9 10 11 12 13 14 15
- Page 117 and 118:
1 2 3 4 5 6 7 8 9 10 11 12 13 14 15
- Page 119 and 120:
1 2 3 4 5 6 7 8 9 10 11 12 13 14 15
- Page 121 and 122:
1 2 3 4 5 6 7 8 9 10 11 12 13 14 15
- Page 123 and 124:
1 2 3 4 5 6 7 8 9 10 11 12 FortisBC
- Page 125 and 126:
FortisBC Inc. (FortisBC or the Comp
- Page 127 and 128:
1 2 3 4 5 6 7 8 9 10 11 12 13 14 15
- Page 129 and 130:
1 2 3 4 5 6 7 8 9 10 11 12 13 14 15
- Page 131 and 132:
1 2 3 4 5 6 7 8 9 10 11 12 13 14 15
- Page 133 and 134:
1 2 3 4 5 6 7 8 9 10 11 12 13 14 15
- Page 135 and 136:
1 2 3 4 5 6 7 8 9 10 11 12 13 14 15
- Page 137 and 138:
1 2 3 4 5 6 7 8 9 10 11 12 Results:
- Page 139 and 140:
Revenue Requirements Analysis Advan
- Page 141 and 142:
Revenue Requirements Analysis Advan
- Page 143 and 144:
Revenue Requirements Analysis Advan
- Page 145 and 146:
Revenue Requirements Analysis Advan
- Page 147 and 148:
1 2 3 4 5 6 7 8 9 10 11 12 13 14 15
- Page 149 and 150:
1 2 3 4 5 6 7 8 9 10 11 12 13 14 15
- Page 151 and 152:
1 2 3 4 5 6 7 8 9 10 11 12 13 14 15
- Page 153 and 154:
1 2 3 4 5 6 7 8 9 10 11 12 13 14 15
- Page 155 and 156:
1 2 3 4 5 6 7 8 9 10 11 12 13 14 15
- Page 157 and 158:
Corporate Headquarters 2111 North M
- Page 159 and 160:
1 2 3 4 5 6 7 8 9 10 11 12 13 14 15
- Page 161 and 162:
1 2 3 4 5 6 7 8 9 10 11 12 13 14 15
- Page 163 and 164:
1 2 3 4 5 6 7 8 9 10 11 12 13 14 15
- Page 165 and 166:
1 2 3 4 5 6 7 8 9 10 11 12 13 14 15
- Page 167 and 168:
1 2 3 4 5 6 7 8 9 10 11 12 13 14 15
- Page 169 and 170:
1 2 3 4 5 6 7 8 9 10 11 Response: F
- Page 171 and 172:
1 2 3 4 5 6 7 8 9 10 11 12 13 14 15
- Page 173 and 174:
1 2 3 4 5 6 7 8 9 10 11 12 13 14 15
- Page 175 and 176:
1 2 3 4 5 6 7 8 9 10 11 12 13 14 15
- Page 177 and 178:
1 2 3 4 5 6 7 8 9 10 11 12 13 Respo
- Page 179 and 180:
1 2 3 4 5 6 7 8 9 10 11 12 13 14 15
- Page 181 and 182:
1 2 3 4 5 6 7 8 9 10 11 12 13 14 15
- Page 183 and 184:
1 2 3 4 5 6 7 8 9 10 11 12 13 14 15
- Page 185 and 186:
1 2 3 4 5 6 7 8 9 10 11 12 13 14 15
- Page 187 and 188:
1 2 3 4 5 6 7 8 9 10 11 12 13 14 15
- Page 189 and 190:
1 2 3 4 5 6 7 8 9 10 11 12 13 14 15
- Page 191 and 192:
1 2 3 4 5 6 7 8 9 10 11 12 13 14 15
- Page 193 and 194:
1 2 3 4 5 6 7 8 9 10 11 12 13 14 15
- Page 195 and 196:
1 2 3 4 5 6 7 8 9 10 11 12 13 14 15
- Page 197 and 198:
1 2 3 4 5 6 7 8 9 10 11 12 13 14 15
- Page 199 and 200:
1 2 3 4 5 6 7 8 9 10 11 12 13 14 15
- Page 201 and 202:
1 2 3 4 5 6 7 8 9 10 11 12 13 14 15
- Page 203 and 204:
1 2 3 FortisBC Inc. (FortisBC or th
- Page 205 and 206:
1 2 3 4 5 6 7 8 9 10 11 12 13 14 15
- Page 207 and 208:
1 2 3 4 5 6 7 8 9 10 11 12 13 14 15
- Page 209 and 210:
1 2 3 4 5 6 7 8 9 10 11 12 13 14 15
- Page 211 and 212:
1 2 3 4 5 6 7 8 9 10 11 12 13 14 15
- Page 213 and 214:
1 2 3 4 5 6 7 8 9 10 11 12 13 14 15
- Page 215 and 216:
1 2 3 4 5 6 7 8 9 10 11 12 13 14 15
- Page 217 and 218:
1 2 3 4 5 6 7 8 9 10 11 12 13 14 15
- Page 219 and 220:
1 2 3 4 5 6 7 8 9 10 11 12 13 14 15
- Page 221 and 222:
1 2 3 4 5 6 7 8 9 10 11 12 13 14 15
- Page 223 and 224:
1 2 3 4 5 6 7 8 9 10 11 12 13 14 15
- Page 225 and 226:
1 2 3 4 5 6 7 8 9 10 11 12 13 14 15
- Page 227 and 228:
1 2 3 4 5 6 7 8 9 10 11 12 13 14 15
- Page 229 and 230:
1 2 3 4 5 6 7 8 9 10 11 12 13 14 15
- Page 231 and 232:
1 2 3 4 5 6 7 8 9 10 11 12 13 14 15
- Page 233 and 234:
1 2 3 4 5 6 7 8 9 10 11 12 13 14 15
- Page 235 and 236:
1 2 3 4 5 6 7 8 9 10 11 12 13 14 15
- Page 237 and 238:
1 2 3 4 5 6 7 8 9 10 11 12 13 14 15
- Page 239 and 240:
1 2 3 4 5 6 7 8 9 10 11 12 13 14 15
- Page 241 and 242:
1 2 3 4 5 6 7 8 9 10 11 12 13 14 15
- Page 243 and 244:
1 2 3 4 5 6 7 8 9 10 11 12 13 14 15
- Page 245 and 246:
1 2 3 4 5 6 7 8 9 10 11 12 13 14 15
- Page 247 and 248:
1 2 3 4 5 6 7 8 9 10 11 12 13 14 15
- Page 249 and 250:
1 2 3 4 5 6 7 8 9 10 11 12 13 14 15
- Page 251 and 252:
1 2 3 4 5 6 7 8 9 10 11 12 13 14 15
- Page 253 and 254:
1 2 3 4 5 6 7 8 9 10 11 12 13 14 15
- Page 255 and 256:
1 2 3 4 5 6 7 8 9 10 11 12 13 14 15
- Page 257 and 258:
Year FortisBC Inc. (FortisBC or the
- Page 259 and 260:
1 2 3 4 5 6 7 8 9 10 FortisBC Inc.
- Page 261 and 262:
1 2 3 4 5 6 7 8 9 10 11 12 13 Forti
- Page 263 and 264:
1 2 3 4 5 6 7 8 9 10 11 12 13 14 15
- Page 265 and 266:
1 2 3 4 5 6 7 8 9 10 11 12 13 14 15
- Page 267 and 268:
1 2 3 4 5 6 7 8 9 10 11 12 13 14 15
- Page 269 and 270:
1 2 3 4 5 6 7 8 9 10 11 12 13 14 15
- Page 271 and 272:
1 2 3 4 5 6 7 8 9 10 11 12 13 14 15
- Page 273 and 274: 1 2 3 4 5 6 7 8 9 10 11 12 13 14 15
- Page 275 and 276: 1 2 3 4 5 6 7 8 9 10 11 12 13 14 15
- Page 277 and 278: 1 2 3 4 5 6 7 8 9 10 11 12 13 14 15
- Page 279 and 280: 1 2 3 4 5 6 7 8 9 10 11 12 13 14 15
- Page 281 and 282: 1 2 3 4 5 6 7 8 9 10 11 12 13 14 15
- Page 283 and 284: 1 2 3 4 5 6 7 8 9 10 11 12 13 14 15
- Page 285 and 286: 1 2 3 4 5 6 7 8 9 10 11 12 13 14 15
- Page 287 and 288: 1 2 3 4 5 6 7 8 9 10 11 12 13 14 15
- Page 289 and 290: 1 2 3 4 5 6 7 8 9 10 11 12 13 14 15
- Page 291 and 292: 1 2 3 4 5 6 7 8 9 10 11 12 13 14 15
- Page 293 and 294: 1 2 3 4 5 6 7 8 9 10 11 12 13 14 15
- Page 295 and 296: 1 2 3 4 5 6 7 8 9 10 11 12 13 14 15
- Page 297 and 298: ASK E SOURCE | UCC-ASKES-53 | PUBLI
- Page 299 and 300: FIGURE 1: Interest in billing optio
- Page 301 and 302: FortisBC, Inc. KELOWNA, BRITISH COL
- Page 303 and 304: TABLE OF CONTENTS PART I. INTRODUCT
- Page 305 and 306: PART I. INTRODUCTION Appendix BCUC
- Page 307 and 308: BASIS OF THE STUDY Depreciation. Th
- Page 309 and 310: PART II. METHODS USED IN THE ESTIMA
- Page 311 and 312: ESTIMATION OF SURVIVOR CURVES Survi
- Page 313 and 314: Iowa Type Curves The range of survi
- Page 315 and 316: Appendix BCUC IR1 69.4
- Page 317 and 318: Appendix BCUC IR1 69.4
- Page 319 and 320: aged property transactions, a sched
- Page 321 and 322: TABLE 2. OTHER TRANSACTIONS FOR EAC
- Page 323: For the entire experience band 2001
- Page 327 and 328: Appendix BCUC IR1 69.4
- Page 329 and 330: Appendix BCUC IR1 69.4
- Page 331 and 332: In Figure 9, the three fittings, 12
- Page 333 and 334: Account 368.00 - Distribution Line
- Page 335 and 336: etirement activity will likely be s
- Page 337 and 338: of removal exceed the salvage proce
- Page 339 and 340: CALCULATION OF ANNUAL AND ACCRUED A
- Page 341 and 342: PART III. RESULTS OF STUDY Appendix
- Page 343 and 344: percent surviving. The titles of th
- Page 345 and 346: FORTISBC, INC. SCHEDULE 2. ESTIMATE
- Page 347 and 348: FORRTISBC, INC. ACCOUNT 3330.10 - L
- Page 349 and 350: FORTISBC, INC. ACCOUNT 330.10 - LAN
- Page 351 and 352: FORTISBC, INC. ACCOUNT 331.00 - STR
- Page 353 and 354: FORRTISBC, INC. ACCOUNT 332.00 - RE
- Page 355 and 356: FORTISBC, INC. ACCOUNT 332.00 - RES
- Page 357 and 358: FORTISBC, INC. ACCOUNT 333.00 - WAT
- Page 359 and 360: FORRTISBC, INC. ACCOUNTT 334.00 - A
- Page 361 and 362: FORTISBC, INC. ACCOUNT 334.00 - ACC
- Page 363 and 364: FORTISBC, INC. ACCOUNT 335.00 - OTH
- Page 365 and 366: FORRTISBC, INC. ACCOUNNT 336.00 - R
- Page 367 and 368: FORTISBC, INC. ACCOUNT 336.00 - ROA
- Page 369 and 370: FORTISBC, INC. ACCOUNT 350.10 - LAN
- Page 371 and 372: FORRTISBC, INC. ACCCOUNT 353.00 - S
- Page 373 and 374: FORTISBC, INC. ACCOUNT 353.00 - SUB
- Page 375 and 376:
FORTISBC, INC. ACCOUNT 355.00 - POL
- Page 377 and 378:
FORRTISBC, INC. ACCCOUNT 356.00 - C
- Page 379 and 380:
FORTISBC, INC. ACCOUNT 356.00 - CON
- Page 381 and 382:
FORTISBC, INC. ACCOUNT 359.00 - ROA
- Page 383 and 384:
FORTISBC, INC. ACCOUNT 360.10 - LAN
- Page 385 and 386:
FORRTISBC, INC. ACCCOUNT 362.00 - S
- Page 387 and 388:
FORTISBC, INC. ACCOUNT 362.00 - SUB
- Page 389 and 390:
FORTISBC, INC. ACCOUNT 364.00 - POL
- Page 391 and 392:
FORRTISBC, INC. ACCCOUNT 365.00 - C
- Page 393 and 394:
FORTISBC, INC. ACCOUNT 365.00 - CON
- Page 395 and 396:
FORTISBC, INC. ACCOUNT 368.00 - LIN
- Page 397 and 398:
FORRTISBC, INC. ACCOUNT 3369.00 - S
- Page 399 and 400:
FORRTISBC, INC. ACCOUNT 370.00 - ME
- Page 401 and 402:
FORTISBC, INC. ACCOUNT 370.00 - MET
- Page 403 and 404:
FORTISBC, INC. ACCOUNT 371.00 - INS
- Page 405 and 406:
FORTISBC, INC. ACCOUNT 373.00 - STR
- Page 407 and 408:
FORRTISBC, INC. ACCOUNNT 390.00 - S
- Page 409 and 410:
FORRTISBC, INC. ACCCOUNT 390.10 - S
- Page 411 and 412:
FORRTISBC, INC. ACCCOUNT 390.20 - O
- Page 413 and 414:
FORRTISBC, INC. ACCCOUNT 392.100 -
- Page 415 and 416:
FORRTISBC, INC. ACCCOUNT 392.200 -
- Page 417 and 418:
PART V. NET SALVAGE STATISTICS Appe
- Page 419 and 420:
FORTISBC, INC. ACCOUNT 332.00 - RES
- Page 421 and 422:
FORTISBC, INC. ACCOUNT 334.00 - ACC
- Page 423 and 424:
FORTISBC, INC. ACCOUNT 350.10 - LAN
- Page 425 and 426:
FORTISBC, INC. ACCOUNT 355.00 - POL
- Page 427 and 428:
FORTISBC, INC. ACCOUNT 362.00 - SUB
- Page 429 and 430:
FORTISBC, INC. ACCOUNT 365.00 - CON
- Page 431 and 432:
FORTISBC, INC. ACCOUNT 370.00 - MET
- Page 433 and 434:
FORTISBC, INC. ACCOUNT 390.10 - STR
- Page 435 and 436:
PART VI. DETAILED DEPRECIATION CALC
- Page 437 and 438:
FORTISBC, INC. ACCOUNT 331.00 - STR
- Page 439 and 440:
FORTISBC, INC. ACCOUNT 333.00 - WAT
- Page 441 and 442:
FORTISBC, INC. ACCOUNT 335.00 - OTH
- Page 443 and 444:
FORTISBC, INC. ACCOUNT 350.10 - LAN
- Page 445 and 446:
FORTISBC, INC. ACCOUNT 355.00 - POL
- Page 447 and 448:
FORTISBC, INC. ACCOUNT 359.00 - ROA
- Page 449 and 450:
FORTISBC, INC. ACCOUNT 362.00 - SUB
- Page 451 and 452:
FORTISBC, INC. ACCOUNT 364.00 - POL
- Page 453 and 454:
FORTISBC, INC. ACCOUNT 368.00 - LIN
- Page 455 and 456:
FORTISBC, INC. ACCOUNT 370.00 - MET
- Page 457 and 458:
FORTISBC, INC. ACCOUNT 373.00 - STR
- Page 459 and 460:
FORTISBC, INC. ACCOUNT 390.10 - STR
- Page 461 and 462:
FORTISBC, INC. ACCOUNT 391.00 - OFF
- Page 463 and 464:
FORTISBC, INC. ACCOUNT 391.20 - PC
- Page 465 and 466:
FORTISBC, INC. ACCOUNT 392.20 - HEA
- Page 467 and 468:
FORTISBC, INC. ACCOUNT 397.00 - COM
- Page 469 and 470:
Public Policy Sources is published
- Page 471 and 472:
Current public policy proposals emp
- Page 473 and 474:
Although there are a host of import
- Page 475 and 476:
Producing Marijuana in British Colu
- Page 477 and 478:
this amounts to about $10,000. 18 T
- Page 479 and 480:
ness that are not about business. I
- Page 481 and 482:
marijuana growing business is not t
- Page 483 and 484:
One point needs reinforcing. These
- Page 485 and 486:
PUBLIC POLICY SOURCES, NUMBER 74 Ta
- Page 487 and 488:
depend upon the prices in the US an
- Page 489 and 490:
Why Does it Happen in British Colum
- Page 491 and 492:
er of days of the sentence. The sec
- Page 493 and 494:
Number of convictions Figure 2: Day
- Page 495 and 496:
have not changed anything else. We
- Page 497 and 498:
References Australian Institute for
- Page 499 and 500:
Appendices Appendix Table 1A Table
- Page 501 and 502:
While this formula is undoubtedly c
- Page 503 and 504:
Appendix B: Risk and the Alternativ
- Page 505 and 506:
Appendix D: Delay Times and the Num
- Page 507 and 508:
Appendix F: The Demand for Marijuan
- Page 509 and 510:
LEDs in spotlight - Greenhouse Cana
- Page 511 and 512:
LEDs in spotlight - Greenhouse Cana
- Page 513 and 514:
I have also canvassed relevant acad
- Page 515 and 516:
some degree of regulation of the in
- Page 517 and 518:
More specifically, it seems likely
- Page 519:
adopt the provisions of the Act of