Health Risks of Ionizing Radiation: - Clark University
Health Risks of Ionizing Radiation: - Clark University
Health Risks of Ionizing Radiation: - Clark University

Create successful ePaper yourself
Turn your PDF publications into a flip-book with our unique Google optimized e-Paper software.
2 Introduction<br />
1.2 A brief history <strong>of</strong> radiation<br />
The history <strong>of</strong> the relationship between science,<br />
radiation and health goes back to the late 19 th<br />
century. X-rays were first discovered in late 1895<br />
and dangers associated with exposure became<br />
apparent very quickly. In 1896 the first injuries<br />
due to x-ray exposure were recorded and in 1904<br />
Thomas Edison’s assistant Clarence Dally was the<br />
first person recorded to have died as a result <strong>of</strong> x-ray<br />
exposure. Despite the risk, the use <strong>of</strong> x-rays for a<br />
variety <strong>of</strong> applications rapidly caught on. During the<br />
First World War portable x-ray machines were used<br />
on both sides to locate shrapnel and to set broken<br />
bones.<br />
Radium was discovered in 1898 and its use in<br />
medicine also spread very quickly. In the 1920s,<br />
sickness and death in watch dial painters, who<br />
ingested small amounts <strong>of</strong> radium in their work,<br />
taught scientists and doctors that internal exposure<br />
to radium could be harmful. It was also during the<br />
1920s that the cancer risks <strong>of</strong> radiology became<br />
apparent. Some awareness was beginning to spread<br />
that radiation exposure from the new technologies<br />
could be harmful and in 1928 the first internationally<br />
recognized radiation safety guidelines were<br />
published.<br />
There was still a popular enthusiasm about<br />
radiation during this time. Between 1920 and 1950<br />
patents were registered for radium toothpaste, radium<br />
hearing aids and radium tonic water. As World War<br />
II emerged in the 1930s plans for building a nuclear<br />
bomb were made. Plutonium was discovered in<br />
1940 and the Manhattan Project, with its goal to<br />
“make the bomb”, was initiated in 1942. On July 16,<br />
1945 the first nuclear weapon was detonated in New<br />
Mexico. At the time <strong>of</strong> the test the type <strong>of</strong> fallout that<br />
would result was something <strong>of</strong> a mystery. In August<br />
<strong>of</strong> 1945 two nuclear bombs were dropped on Japan<br />
in Nagasaki and Hiroshima. In the weeks after the<br />
bombs, radiation exposure was not discussed in the<br />
US press.<br />
In the 1950s the US government began a<br />
campaign for a more friendly attitude toward<br />
nuclear science and promoted civil nuclear power.<br />
There were hundreds <strong>of</strong> uranium mines across the<br />
country serving both the nuclear power industry<br />
and the nuclear weapons industry. In 1951 the US<br />
established the Nevada Test Site in order to have a<br />
domestic testing location that could ease logistical<br />
and security concerns. Prior to this tests had been<br />
conducted in the South Pacific. The fallout from<br />
the test sites and the occupational hazards <strong>of</strong> the<br />
workers in the mines and in the weapons factories<br />
were adding to the range <strong>of</strong> radiation exposures that<br />
we experience.<br />
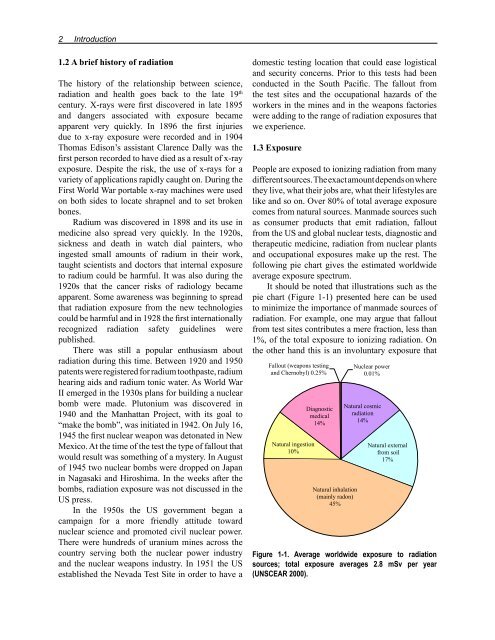
1.3 Exposure<br />
People are exposed to ionizing radiation from many<br />
different sources. The exact amount depends on where<br />
they live, what their jobs are, what their lifestyles are<br />
like and so on. Over 80% <strong>of</strong> total average exposure<br />
comes from natural sources. Manmade sources such<br />
as consumer products that emit radiation, fallout<br />
from the US and global nuclear tests, diagnostic and<br />
therapeutic medicine, radiation from nuclear plants<br />
and occupational exposures make up the rest. The<br />
following pie chart gives the estimated worldwide<br />
average exposure spectrum.<br />
It should be noted that illustrations such as the<br />
pie chart (Figure 1-1) presented here can be used<br />
to minimize the importance <strong>of</strong> manmade sources <strong>of</strong><br />
radiation. For example, one may argue that fallout<br />
from test sites contributes a mere fraction, less than<br />
1%, <strong>of</strong> the total exposure to ionizing radiation. On<br />
the other hand this is an involuntary exposure that<br />
<br />
<br />
<br />
<br />
<br />
<br />
<br />
<br />
<br />
<br />
<br />
<br />
<br />
<br />
<br />
<br />
<br />
<br />
Figure 1-1. Average worldwide exposure to radiation<br />
sources; total exposure averages 2.8 mSv per year<br />
(UNSCEAR 2000).