Health Risks of Ionizing Radiation: - Clark University
Health Risks of Ionizing Radiation: - Clark University
Health Risks of Ionizing Radiation: - Clark University
You also want an ePaper? Increase the reach of your titles
YUMPU automatically turns print PDFs into web optimized ePapers that Google loves.
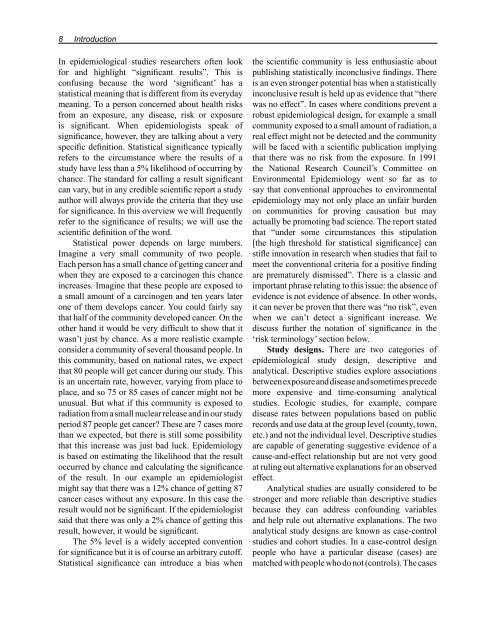
8 Introduction<br />
In epidemiological studies researchers <strong>of</strong>ten look<br />
for and highlight “significant results”. This is<br />
confusing because the word ‘significant’ has a<br />
statistical meaning that is different from its everyday<br />
meaning. To a person concerned about health risks<br />
from an exposure, any disease, risk or exposure<br />
is significant. When epidemiologists speak <strong>of</strong><br />
significance, however, they are talking about a very<br />
specific definition. Statistical significance typically<br />
refers to the circumstance where the results <strong>of</strong> a<br />
study have less than a 5% likelihood <strong>of</strong> occurring by<br />
chance. The standard for calling a result significant<br />
can vary, but in any credible scientific report a study<br />
author will always provide the criteria that they use<br />
for significance. In this overview we will frequently<br />
refer to the significance <strong>of</strong> results; we will use the<br />
scientific definition <strong>of</strong> the word.<br />
Statistical power depends on large numbers.<br />
Imagine a very small community <strong>of</strong> two people.<br />
Each person has a small chance <strong>of</strong> getting cancer and<br />
when they are exposed to a carcinogen this chance<br />
increases. Imagine that these people are exposed to<br />
a small amount <strong>of</strong> a carcinogen and ten years later<br />
one <strong>of</strong> them develops cancer. You could fairly say<br />
that half <strong>of</strong> the community developed cancer. On the<br />
other hand it would be very difficult to show that it<br />
wasn’t just by chance. As a more realistic example<br />
consider a community <strong>of</strong> several thousand people. In<br />
this community, based on national rates, we expect<br />
that 80 people will get cancer during our study. This<br />
is an uncertain rate, however, varying from place to<br />
place, and so 75 or 85 cases <strong>of</strong> cancer might not be<br />
unusual. But what if this community is exposed to<br />
radiation from a small nuclear release and in our study<br />
period 87 people get cancer? These are 7 cases more<br />
than we expected, but there is still some possibility<br />
that this increase was just bad luck. Epidemiology<br />
is based on estimating the likelihood that the result<br />
occurred by chance and calculating the significance<br />
<strong>of</strong> the result. In our example an epidemiologist<br />
might say that there was a 12% chance <strong>of</strong> getting 87<br />
cancer cases without any exposure. In this case the<br />
result would not be significant. If the epidemiologist<br />
said that there was only a 2% chance <strong>of</strong> getting this<br />
result, however, it would be significant.<br />
The 5% level is a widely accepted convention<br />
for significance but it is <strong>of</strong> course an arbitrary cut<strong>of</strong>f.<br />
Statistical significance can introduce a bias when<br />
the scientific community is less enthusiastic about<br />
publishing statistically inconclusive findings. There<br />
is an even stronger potential bias when a statistically<br />
inconclusive result is held up as evidence that “there<br />
was no effect”. In cases where conditions prevent a<br />
robust epidemiological design, for example a small<br />
community exposed to a small amount <strong>of</strong> radiation, a<br />
real effect might not be detected and the community<br />
will be faced with a scientific publication implying<br />
that there was no risk from the exposure. In 1991<br />
the National Research Council’s Committee on<br />
Environmental Epidemiology went so far as to<br />
say that conventional approaches to environmental<br />
epidemiology may not only place an unfair burden<br />
on communities for proving causation but may<br />
actually be promoting bad science. The report stated<br />
that “under some circumstances this stipulation<br />
[the high threshold for statistical significance] can<br />
stifle innovation in research when studies that fail to<br />
meet the conventional criteria for a positive finding<br />
are prematurely dismissed”. There is a classic and<br />
important phrase relating to this issue: the absence <strong>of</strong><br />
evidence is not evidence <strong>of</strong> absence. In other words,<br />
it can never be proven that there was “no risk”, even<br />
when we can’t detect a significant increase. We<br />
discuss further the notation <strong>of</strong> significance in the<br />
‘risk terminology’ section below.<br />
Study designs. There are two categories <strong>of</strong><br />
epidemiological study design, descriptive and<br />
analytical. Descriptive studies explore associations<br />
between exposure and disease and sometimes precede<br />
more expensive and time-consuming analytical<br />
studies. Ecologic studies, for example, compare<br />
disease rates between populations based on public<br />
records and use data at the group level (county, town,<br />
etc.) and not the individual level. Descriptive studies<br />
are capable <strong>of</strong> generating suggestive evidence <strong>of</strong> a<br />
cause-and-effect relationship but are not very good<br />
at ruling out alternative explanations for an observed<br />
effect.<br />
Analytical studies are usually considered to be<br />
stronger and more reliable than descriptive studies<br />
because they can address confounding variables<br />
and help rule out alternative explanations. The two<br />
analytical study designs are known as case-control<br />
studies and cohort studies. In a case-control design<br />
people who have a particular disease (cases) are<br />
matched with people who do not (controls). The cases


