Health Risks of Ionizing Radiation: - Clark University
Health Risks of Ionizing Radiation: - Clark University
Health Risks of Ionizing Radiation: - Clark University

You also want an ePaper? Increase the reach of your titles
YUMPU automatically turns print PDFs into web optimized ePapers that Google loves.
48 Atomic Bomb Survivors<br />
approximating a supralinear curve. For example,<br />
over the dose range 5-20 mSv the ERR estimate is<br />
2.6/Sv and it declines steadily as dose increases 4 .<br />
Solid cancer mortality depends on age at exposure<br />
and gender; specifically, risks are higher for females<br />
and for childhood exposure. The 2003 analysis<br />
generated an average ERR estimate <strong>of</strong> 0.47/Sv<br />
(averaged for both sexes and assuming exposure at<br />
age 30). As in the 1996 analysis, the dose-response<br />
curve was steeper at lower doses so that the ERR<br />
estimate was 0.74/Sv (0.1-1.5) for doses less than<br />
120 mSv. The effect <strong>of</strong> age at exposure was described<br />
as a decrease in the ERR estimate by 36% per 10-yr<br />
increase in age at exposure. Exposures in infancy,<br />
for example, would be associated with a solid<br />
cancer mortality ERR <strong>of</strong> ~1.9/Sv 5 . Delongchamp<br />
et al. (1997) calculated a similar ERR estimate <strong>of</strong><br />
1.4/Sv (90% CI 0.4-3.1) for adult cancer mortality<br />
after exposures in early childhood (less than 6 years<br />
old).<br />
The dose-response pattern <strong>of</strong> leukemia mortality<br />
is best described with a nonlinear model so that<br />
one estimate <strong>of</strong> ERR/Sv would be misleading.<br />
Pierce et al. (1996) presented summary estimates<br />
<strong>of</strong> leukemia mortality risk with an ERR <strong>of</strong> 4.6/Sv<br />
(90% CI 3.3-6.4), apparently based on a linear<br />
model. The effect <strong>of</strong> age at exposure on leukemia<br />
mortality was complicated. Exposures in childhood<br />
were associated with higher risks in the first 10 or 20<br />
years after exposure. If we consider the risk over the<br />
entire follow-up period to date, however, then risks<br />
are about the same for all ages at exposure. This<br />
pattern can also be described by saying that leukemia<br />
mortality risks declined over time, and this decline<br />
was steeper for people exposed in childhood.<br />
4.3 Noncancer mortality<br />
Noncancer mortality through 1990 was assessed<br />
by Shimizu et al. (1999) and additional followup<br />
through 1997 was discussed by Preston et al.<br />
(2003). The pattern <strong>of</strong> deaths from noncancer<br />
diseases showed a strong healthy survivor effect.<br />
This was evident in a lower noncancer mortality<br />
rate among proximal survivors for a few years after<br />
the bombings; the people that were strong enough<br />
to survive the bombings were apparently healthier<br />
than average. This effect diminished over time; to<br />
account for this effect noncancer mortality risks<br />
were estimated based on data from 1968-1997<br />
(Preston et al. 2003). Generally the noncancer<br />
mortality rates were associated with dose, although<br />
the effect was smaller than that seen for cancer, and<br />
the dose-response pattern could be described as<br />
linear. Deaths from stroke, heart disease, respiratory<br />
disease, and digestive disease increased by 10-20%<br />
per Sv (ERR 0.1-0.2/Sv). Blood diseases were an<br />
exception, showing a stronger effect with an ERR<br />
<strong>of</strong> 1.9/Sv (1.2-2.9; Shimizu et al. 1999). There was<br />
some evidence, not significant, <strong>of</strong> an effect <strong>of</strong> age at<br />
exposure that was similar to that seen with cancer<br />
mortality.<br />
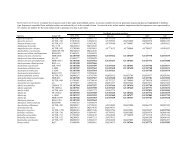
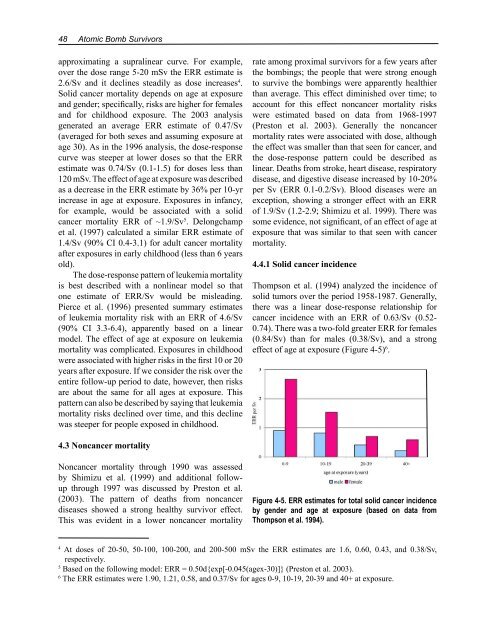
4.4.1 Solid cancer incidence<br />
Thompson et al. (1994) analyzed the incidence <strong>of</strong><br />
solid tumors over the period 1958-1987. Generally,<br />
there was a linear dose-response relationship for<br />
cancer incidence with an ERR <strong>of</strong> 0.63/Sv (0.52-<br />
0.74). There was a two-fold greater ERR for females<br />
(0.84/Sv) than for males (0.38/Sv), and a strong<br />
effect <strong>of</strong> age at exposure (Figure 4-5) 6 .<br />
Figure 4-5. ERR estimates for total solid cancer incidence<br />
by gender and age at exposure (based on data from<br />
Thompson et al. 1994).<br />
4 At doses <strong>of</strong> 20-50, 50-100, 100-200, and 200-500 mSv the ERR estimates are 1.6, 0.60, 0.43, and 0.38/Sv,<br />
respectively.<br />
5 Based on the following model: ERR = 0.50d{exp[-0.045(agex-30)]} (Preston et al. 2003).<br />
6 The ERR estimates were 1.90, 1.21, 0.58, and 0.37/Sv for ages 0-9, 10-19, 20-39 and 40+ at exposure.