Health Risks of Ionizing Radiation: - Clark University
Health Risks of Ionizing Radiation: - Clark University
Health Risks of Ionizing Radiation: - Clark University

Create successful ePaper yourself
Turn your PDF publications into a flip-book with our unique Google optimized e-Paper software.
86 <strong>Radiation</strong> Workers<br />
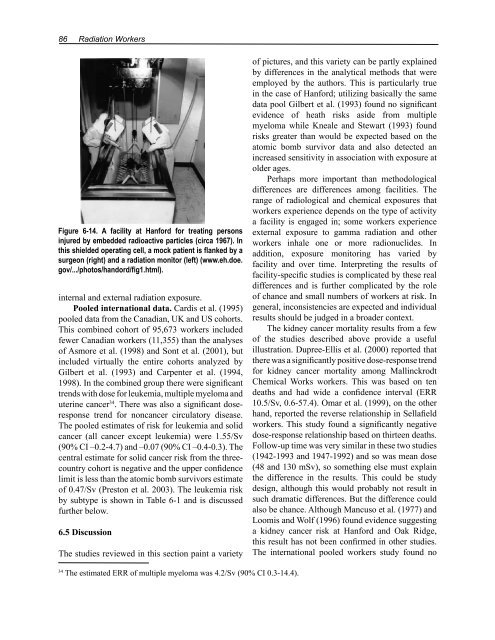
Figure 6-14. A facility at Hanford for treating persons<br />
injured by embedded radioactive particles (circa 1967). In<br />
this shielded operating cell, a mock patient is flanked by a<br />
surgeon (right) and a radiation monitor (left) (www.eh.doe.<br />
gov/.../photos/handord/fig1.html).<br />
internal and external radiation exposure.<br />
Pooled international data. Cardis et al. (1995)<br />
pooled data from the Canadian, UK and US cohorts.<br />
This combined cohort <strong>of</strong> 95,673 workers included<br />
fewer Canadian workers (11,355) than the analyses<br />
<strong>of</strong> Asmore et al. (1998) and Sont et al. (2001), but<br />
included virtually the entire cohorts analyzed by<br />
Gilbert et al. (1993) and Carpenter et al. (1994,<br />
1998). In the combined group there were significant<br />
trends with dose for leukemia, multiple myeloma and<br />
uterine cancer 34 . There was also a significant doseresponse<br />
trend for noncancer circulatory disease.<br />
The pooled estimates <strong>of</strong> risk for leukemia and solid<br />
cancer (all cancer except leukemia) were 1.55/Sv<br />
(90% CI –0.2-4.7) and –0.07 (90% CI –0.4-0.3). The<br />
central estimate for solid cancer risk from the threecountry<br />
cohort is negative and the upper confidence<br />
limit is less than the atomic bomb survivors estimate<br />
<strong>of</strong> 0.47/Sv (Preston et al. 2003). The leukemia risk<br />
by subtype is shown in Table 6-1 and is discussed<br />
further below.<br />
6.5 Discussion<br />
The studies reviewed in this section paint a variety<br />
34 The estimated ERR <strong>of</strong> multiple myeloma was 4.2/Sv (90% CI 0.3-14.4).<br />
<strong>of</strong> pictures, and this variety can be partly explained<br />
by differences in the analytical methods that were<br />
employed by the authors. This is particularly true<br />
in the case <strong>of</strong> Hanford; utilizing basically the same<br />
data pool Gilbert et al. (1993) found no significant<br />
evidence <strong>of</strong> heath risks aside from multiple<br />
myeloma while Kneale and Stewart (1993) found<br />
risks greater than would be expected based on the<br />
atomic bomb survivor data and also detected an<br />
increased sensitivity in association with exposure at<br />
older ages.<br />
Perhaps more important than methodological<br />
differences are differences among facilities. The<br />
range <strong>of</strong> radiological and chemical exposures that<br />
workers experience depends on the type <strong>of</strong> activity<br />
a facility is engaged in; some workers experience<br />
external exposure to gamma radiation and other<br />
workers inhale one or more radionuclides. In<br />
addition, exposure monitoring has varied by<br />
facility and over time. Interpreting the results <strong>of</strong><br />
facility-specific studies is complicated by these real<br />
differences and is further complicated by the role<br />
<strong>of</strong> chance and small numbers <strong>of</strong> workers at risk. In<br />
general, inconsistencies are expected and individual<br />
results should be judged in a broader context.<br />
The kidney cancer mortality results from a few<br />
<strong>of</strong> the studies described above provide a useful<br />
illustration. Dupree-Ellis et al. (2000) reported that<br />
there was a significantly positive dose-response trend<br />
for kidney cancer mortality among Mallinckrodt<br />
Chemical Works workers. This was based on ten<br />
deaths and had wide a confidence interval (ERR<br />
10.5/Sv, 0.6-57.4). Omar et al. (1999), on the other<br />
hand, reported the reverse relationship in Sellafield<br />
workers. This study found a significantly negative<br />
dose-response relationship based on thirteen deaths.<br />
Follow-up time was very similar in these two studies<br />
(1942-1993 and 1947-1992) and so was mean dose<br />
(48 and 130 mSv), so something else must explain<br />
the difference in the results. This could be study<br />
design, although this would probably not result in<br />
such dramatic differences. But the difference could<br />
also be chance. Although Mancuso et al. (1977) and<br />
Loomis and Wolf (1996) found evidence suggesting<br />
a kidney cancer risk at Hanford and Oak Ridge,<br />
this result has not been confirmed in other studies.<br />
The international pooled workers study found no