Health Risks of Ionizing Radiation: - Clark University
Health Risks of Ionizing Radiation: - Clark University
Health Risks of Ionizing Radiation: - Clark University
You also want an ePaper? Increase the reach of your titles
YUMPU automatically turns print PDFs into web optimized ePapers that Google loves.
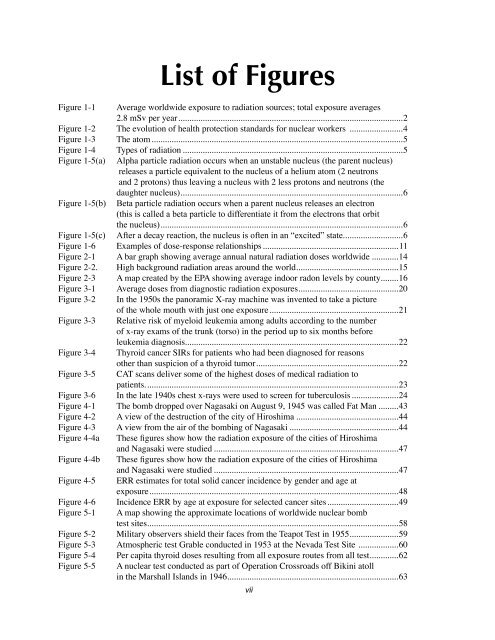
List <strong>of</strong> Figures<br />
Figure 1-1 Average worldwide exposure to radiation sources; total exposure averages<br />
2.8 mSv per year .....................................................................................................2<br />
Figure 1-2 The evolution <strong>of</strong> health protection standards for nuclear workers ........................4<br />
Figure 1-3 The atom .................................................................................................................5<br />
Figure 1-4 Types <strong>of</strong> radiation ...................................................................................................5<br />
Figure 1-5(a) Alpha particle radiation occurs when an unstable nucleus (the parent nucleus)<br />
releases a particle equivalent to the nucleus <strong>of</strong> a helium atom (2 neutrons<br />
and 2 protons) thus leaving a nucleus with 2 less protons and neutrons (the<br />
daughter nucleus) ....................................................................................................6<br />
Figure 1-5(b) Beta particle radiation occurs when a parent nucleus releases an electron<br />
(this is called a beta particle to differentiate it from the electrons that orbit<br />
the nucleus) .............................................................................................................6<br />
Figure 1-5(c) After a decay reaction, the nucleus is <strong>of</strong>ten in an “excited” state. ..........................6<br />
Figure 1-6 Examples <strong>of</strong> dose-response relationships .............................................................11<br />
Figure 2-1 A bar graph showing average annual natural radiation doses worldwide ............14<br />
Figure 2-2. High background radiation areas around the world ..............................................15<br />
Figure 2-3 A map created by the EPA showing average indoor radon levels by county ........16<br />
Figure 3-1 Average doses from diagnostic radiation exposures .............................................20<br />
Figure 3-2 In the 1950s the panoramic X-ray machine was invented to take a picture<br />
<strong>of</strong> the whole mouth with just one exposure ..........................................................21<br />
Figure 3-3 Relative risk <strong>of</strong> myeloid leukemia among adults according to the number<br />
<strong>of</strong> x-ray exams <strong>of</strong> the trunk (torso) in the period up to six months before<br />
leukemia diagnosis ................................................................................................22<br />
Figure 3-4 Thyroid cancer SIRs for patients who had been diagnosed for reasons<br />
other than suspicion <strong>of</strong> a thyroid tumor ................................................................22<br />
Figure 3-5 CAT scans deliver some <strong>of</strong> the highest doses <strong>of</strong> medical radiation to<br />
patients. .................................................................................................................23<br />
Figure 3-6 In the late 1940s chest x-rays were used to screen for tuberculosis .....................24<br />
Figure 4-1 The bomb dropped over Nagasaki on August 9, 1945 was called Fat Man .........43<br />
Figure 4-2 A view <strong>of</strong> the destruction <strong>of</strong> the city <strong>of</strong> Hiroshima ..............................................44<br />
Figure 4-3 A view from the air <strong>of</strong> the bombing <strong>of</strong> Nagasaki .................................................44<br />
Figure 4-4a These figures show how the radiation exposure <strong>of</strong> the cities <strong>of</strong> Hiroshima<br />
and Nagasaki were studied ...................................................................................47<br />
Figure 4-4b These figures show how the radiation exposure <strong>of</strong> the cities <strong>of</strong> Hiroshima<br />
and Nagasaki were studied ...................................................................................47<br />
Figure 4-5 ERR estimates for total solid cancer incidence by gender and age at<br />
exposure ................................................................................................................48<br />
Figure 4-6 Incidence ERR by age at exposure for selected cancer sites ................................49<br />
Figure 5-1 A map showing the approximate locations <strong>of</strong> worldwide nuclear bomb<br />
test sites .................................................................................................................58<br />
Figure 5-2 Military observers shield their faces from the Teapot Test in 1955 ......................59<br />
Figure 5-3 Atmospheric test Grable conducted in 1953 at the Nevada Test Site ..................60<br />
Figure 5-4 Per capita thyroid doses resulting from all exposure routes from all test .............62<br />
Figure 5-5 A nuclear test conducted as part <strong>of</strong> Operation Crossroads <strong>of</strong>f Bikini atoll<br />
in the Marshall Islands in 1946 .............................................................................63<br />
vii


