Health Risks of Ionizing Radiation: - Clark University
Health Risks of Ionizing Radiation: - Clark University
Health Risks of Ionizing Radiation: - Clark University

Create successful ePaper yourself
Turn your PDF publications into a flip-book with our unique Google optimized e-Paper software.
76 <strong>Radiation</strong> Workers<br />
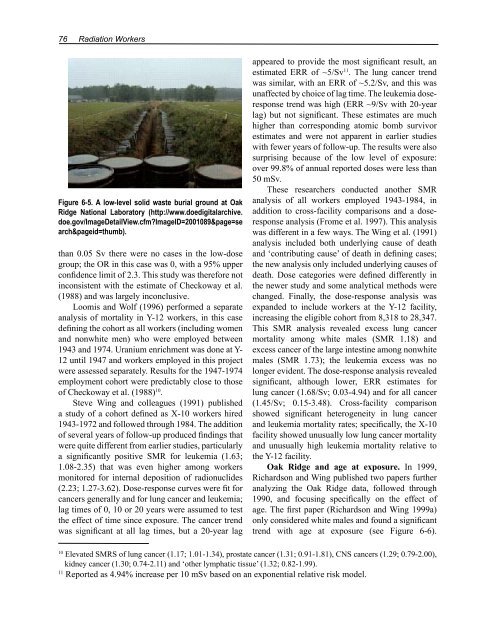
Figure 6-5. A low-level solid waste burial ground at Oak<br />
Ridge National Laboratory (http://www.doedigitalarchive.<br />
doe.gov/ImageDetailView.cfm?ImageID=2001089&page=se<br />
arch&pageid=thumb).<br />
than 0.05 Sv there were no cases in the low-dose<br />
group; the OR in this case was 0, with a 95% upper<br />
confidence limit <strong>of</strong> 2.3. This study was therefore not<br />
inconsistent with the estimate <strong>of</strong> Checkoway et al.<br />
(1988) and was largely inconclusive.<br />
Loomis and Wolf (1996) performed a separate<br />
analysis <strong>of</strong> mortality in Y-12 workers, in this case<br />
defining the cohort as all workers (including women<br />
and nonwhite men) who were employed between<br />
1943 and 1974. Uranium enrichment was done at Y-<br />
12 until 1947 and workers employed in this project<br />
were assessed separately. Results for the 1947-1974<br />
employment cohort were predictably close to those<br />
<strong>of</strong> Checkoway et al. (1988) 10 .<br />
Steve Wing and colleagues (1991) published<br />
a study <strong>of</strong> a cohort defined as X-10 workers hired<br />
1943-1972 and followed through 1984. The addition<br />
<strong>of</strong> several years <strong>of</strong> follow-up produced findings that<br />
were quite different from earlier studies, particularly<br />
a significantly positive SMR for leukemia (1.63;<br />
1.08-2.35) that was even higher among workers<br />
monitored for internal deposition <strong>of</strong> radionuclides<br />
(2.23; 1.27-3.62). Dose-response curves were fit for<br />
cancers generally and for lung cancer and leukemia;<br />
lag times <strong>of</strong> 0, 10 or 20 years were assumed to test<br />
the effect <strong>of</strong> time since exposure. The cancer trend<br />
was significant at all lag times, but a 20-year lag<br />
appeared to provide the most significant result, an<br />
estimated ERR <strong>of</strong> ~5/Sv 11 . The lung cancer trend<br />
was similar, with an ERR <strong>of</strong> ~5.2/Sv, and this was<br />
unaffected by choice <strong>of</strong> lag time. The leukemia doseresponse<br />
trend was high (ERR ~9/Sv with 20-year<br />
lag) but not significant. These estimates are much<br />
higher than corresponding atomic bomb survivor<br />
estimates and were not apparent in earlier studies<br />
with fewer years <strong>of</strong> follow-up. The results were also<br />
surprising because <strong>of</strong> the low level <strong>of</strong> exposure:<br />
over 99.8% <strong>of</strong> annual reported doses were less than<br />
50 mSv.<br />
These researchers conducted another SMR<br />
analysis <strong>of</strong> all workers employed 1943-1984, in<br />
addition to cross-facility comparisons and a doseresponse<br />
analysis (Frome et al. 1997). This analysis<br />
was different in a few ways. The Wing et al. (1991)<br />
analysis included both underlying cause <strong>of</strong> death<br />
and ‘contributing cause’ <strong>of</strong> death in defining cases;<br />
the new analysis only included underlying causes <strong>of</strong><br />
death. Dose categories were defined differently in<br />
the newer study and some analytical methods were<br />
changed. Finally, the dose-response analysis was<br />
expanded to include workers at the Y-12 facility,<br />
increasing the eligible cohort from 8,318 to 28,347.<br />
This SMR analysis revealed excess lung cancer<br />
mortality among white males (SMR 1.18) and<br />
excess cancer <strong>of</strong> the large intestine among nonwhite<br />
males (SMR 1.73); the leukemia excess was no<br />
longer evident. The dose-response analysis revealed<br />
significant, although lower, ERR estimates for<br />
lung cancer (1.68/Sv; 0.03-4.94) and for all cancer<br />
(1.45/Sv; 0.15-3.48). Cross-facility comparison<br />
showed significant heterogeneity in lung cancer<br />
and leukemia mortality rates; specifically, the X-10<br />
facility showed unusually low lung cancer mortality<br />
and unusually high leukemia mortality relative to<br />
the Y-12 facility.<br />
Oak Ridge and age at exposure. In 1999,<br />
Richardson and Wing published two papers further<br />
analyzing the Oak Ridge data, followed through<br />
1990, and focusing specifically on the effect <strong>of</strong><br />
age. The first paper (Richardson and Wing 1999a)<br />
only considered white males and found a significant<br />
trend with age at exposure (see Figure 6-6).<br />
10 Elevated SMRS <strong>of</strong> lung cancer (1.17; 1.01-1.34), prostate cancer (1.31; 0.91-1.81), CNS cancers (1.29; 0.79-2.00),<br />
kidney cancer (1.30; 0.74-2.11) and ‘other lymphatic tissue’ (1.32; 0.82-1.99).<br />
11 Reported as 4.94% increase per 10 mSv based on an exponential relative risk model.